Adding structured data to your website pages is extremely important as rich results continue to take the place of the plain old blue links.
In Google’s announcement of the Rich Results Test Tool getting out of beta, they said:
“Rich results are experiences on Google Search that go beyond the standard blue link. They’re powered by structured data and can include carousels, images, or other non-textual elements. Over the last couple years we’ve developed the Rich Results Test to help you test your structured data and preview your rich results.”
While the improvements to the tool are really welcome and there are a decent number of tools and plugins that help produce structured data, there is still a significant gap.
Adding correct structured data to webpages remains a manual effort, and as it requires playing with code, which is very prone to human error.
In this post, I’m going to introduce a fairly advanced technique that can help produce quality structured data without manual input.
ADVERTISEMENT
CONTINUE READING BELOW
It relies on the latest advances in computer vision and connecting concepts from completely different disciplines.
Here is our technical plan:
- We will leverage a list of product page screenshots that my team annotated to indicate things like product name, price, description, main image, etc.
- We will convert the annotations to a format expected by Google AutoML Object Detection Service.
- We will go through the steps to upload the annotated images, train, and evaluate a model that can predict the annotations on new screenshots.
- We will run the prediction code from Python on new images.
- We will take new screenshots automatically using puppeteer and inject JavaScript code to convert the predictions into structured data.
- We will review some of the key concepts that make this technique possible.
Let’s review some foundational concepts first.
Computer Vision 101
The best way to learn and appreciate the power of computer vision is to run a quick example.
I put together a simple Colab notebook that basically follows the steps outlined in this repo from Streamlit.
Please make a copy and select Runtime > Run all, to run all cells.
In the end, you should get a dynamic ngrok URL.
Copy and paste it in your browser and after the YOLO weights download, you select Run the App in the sidebar, you should see the demo web app below.
This web app allows you to browse different images and apply the computer vision algorithm YOLO3, which stands for You Only Look Once.
ADVERTISEMENT
CONTINUE READING BELOW
You will notice that the objects of interest in the pictures (cars, people, etc.) are represented by colored boxes.
These are called bounding boxes in Computer Vision and the task that can predict them is called object detection.
Similar to any supervised deep learning task, object detection algorithms require labeled datasets.
The datasets for object detection include images and the labels plus the coordinates of the boxes that contain the labels.
There is some heavy-duty manual work required in labeling objects in images.
Fortunately, as I don’t need to ask for permission in my business, I am sharing 200 images already curated by my team that you can use to complete this tutorial.
We will learn the process we used to put our full dataset together and ways to scale it automatically so you don’t need to manually label every image.
Browser Automation for Image Capturing
In one of my early columns, I introduced the idea of automating the Chrome browser to help us perform repetitive tasks where we don’t have an API.
As our idea is to take screenshots of web pages and apply object detection to the images to get structured data, we can automate part of the process with browser automation.
Given a list of, for example, product URLs, we can run a puppeteer script (or pyppeteer in Python) to open all web pages and save screenshots to disk.
Now, the screenshots alone are not enough. We also need the labels for each structured data type and bounding box.
There are at least a couple of approaches to do this.
The first and obvious one is to have a data entry person/team manually label the screenshots.
That is the approach we took when we initially tried this a couple of years ago.
We used an open-source tool, called LabelImg and our data entry person manually draw boxes over the objects of interest.
ADVERTISEMENT
CONTINUE READING BELOW
The results of the labeling are saved in a standard format. In our case, we used the DetectNet format.
This format creates a txt file for every image with a line for each object. Each line includes a label and coordinates.
Another, more scalable approach that we use more recently, is to screenshot pages that already have structured data and use the structured data to calculate the labels and the coordinates of the boxes.
We still combine it with human supervision, but primarily to make sure the process produces quality training data.
Google AutoML for Vision Object Detection
When we first tried this idea a couple of years ago, we had to do it the really hard way!
I actually briefly mentioned it during my TechSEO Boost talk in 2018.
I learned about object detection during my Deep Learning specialization with Coursera and immediately connected the dots.
ADVERTISEMENT
CONTINUE READING BELOW
We learned to use YOLO, but in practice I found Faster-RCNN to be the best performing approach back then.
The Tensorflow Object Detection API made things a bit simpler, but nowhere near as simple as it is with AutoML.
When use AutoML, we only need to provide the data in the format expected and provide enough examples for each label/bounding box. At this time, the service only needs 10.
We had to get hundreds of examples of each label to get decent performance back then.
Now that we understand the basics, let’s get to work.
Preparing our Dataset for AutoML
Let’s review an example from our product dataset. We have two files for every image.
The first file is the image itself like the one below.
You can display it in Google Colab using the following Python lines.
ADVERTISEMENT
CONTINUE READING BELOW
import numpy as np

import cv2
img = cv2.imread("img1063.jpg", cv2.IMREAD_COLOR)
from google.colab.patches import cv2_imshow
cv2_imshow(img)
The second part is the corresponding DetectNet text file with the labels.
You can review it with the command line.
!cat imag1063.txt
main product image 0.0 0 0.0 30 82 790 561 0.0 0.0 0.0 0.0 0.0 0.0 0.0
original price 0.0 0 0.0 836 99 903 116 0.0 0.0 0.0 0.0 0.0 0.0 0.0
price 0.0 0 0.0 837 125 939 151 0.0 0.0 0.0 0.0 0.0 0.0 0.0
product name 0.0 0 0.0 31 8 798 39 0.0 0.0 0.0 0.0 0.0 0.0 0.0
reviews 0.0 0 0.0 114 41 315 63 0.0 0.0 0.0 0.0 0.0 0.0 0.0
quantity 0.0 0 0.0 836 198 1303 253 0.0 0.0 0.0 0.0 0.0 0.0 0.0
add to cart 0.0 0 0.0 837 289 1302 354 0.0 0.0 0.0 0.0 0.0 0.0 0.0
product description 0.0 0 0.0 843 367 1304 556 0.0 0.0 0.0 0.0 0.0 0.0 0.0
There is a line for every labeled object in the screenshot. The line includes the label name and the bounding box coordinates.
Let’s see how this specific example looks like when I load it into AutoML.
You can see how structured data elements are carefully labeled with bounding boxes.
We have the product name, price, quantity, reviews, description, etc.
Before I was able to upload my examples, I needed to convert them to the format expected by AutoML.
I also needed to upload the images to a Google Cloud Storage bucket, but that part is straightforward.
The format is: set,path,label,x_min,y_min,,,x_max,y_max,,
ADVERTISEMENT
CONTINUE READING BELOW
First, I read the files from disk and created a list of dictionaries one per each bounding box.
defaultdict(<class 'int'>,
            {'add to cart': 2308,
             'add to wishlist': 978,
             'additional product images': 1292,
             'availability': 832,
             'color': 600,
             'main product image': 2981,
             'price': 2719,
             'product description': 1965,
             'product name': 2888,
             'quantity': 1738,
             'reviews': 473,
             'size': 1050})
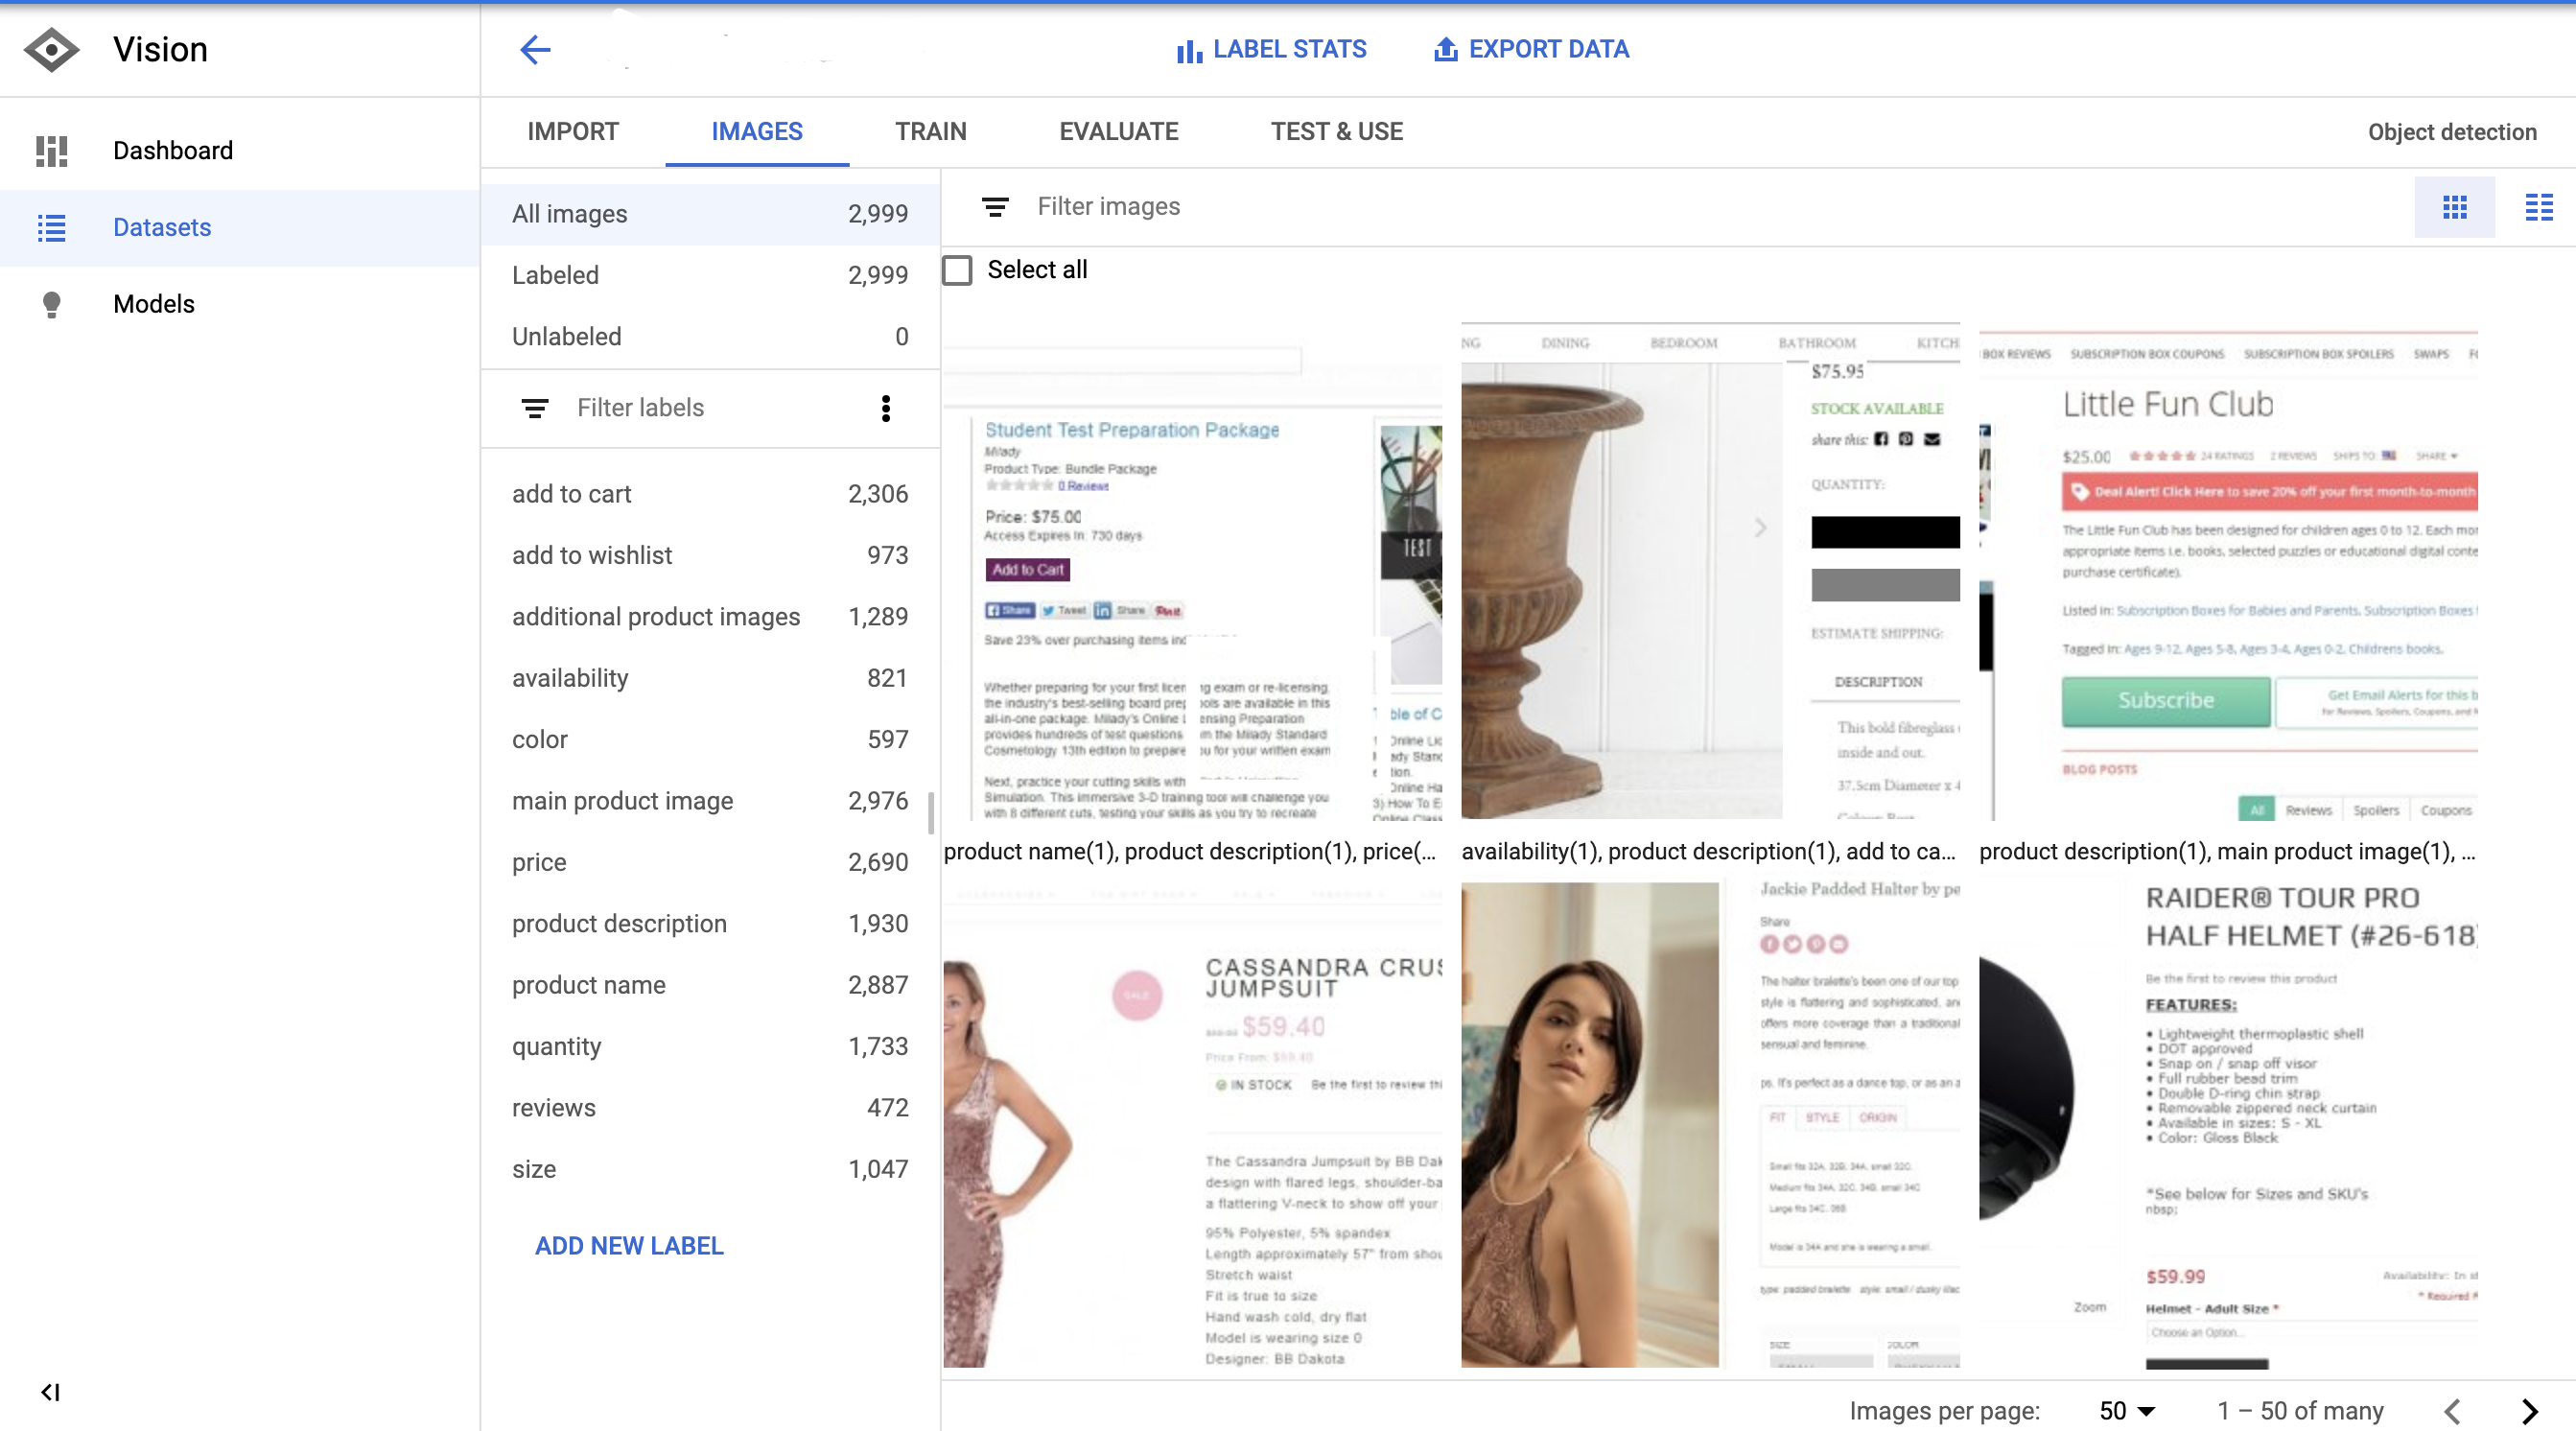
Here you can see how many examples I have per bounding box/object.
Here is what one example looks like:
{'objects': [{'name': 'main product image',
   'xmax': 0.4351371386212009,
   'xmin': 0.06745737583395107,
   'ymax': 1.0,
   'ymin': 0.6900175131348512},
  {'name': 'price',
   'xmax': 0.5559673832468495,
   'xmin': 0.5100074128984433,
   'ymax': 0.043782837127845885,
   'ymin': 0.008756567425569177},
  {'name': 'add to wishlist',
   'xmax': 0.5959970348406227,
   'xmin': 0.508524833209785,
   'ymax': 0.29422066549912435,
   'ymin': 0.2714535901926445},
  {'name': 'quantity',
   'xmax': 0.6404744255003706,
   'xmin': 0.508524833209785,
   'ymax': 0.6234676007005254,
   'ymin': 0.5516637478108581},
  {'name': 'size',
   'xmax': 0.793180133432172,
   'xmin': 0.5070422535211268,
   'ymax': 0.7408056042031523,
   'ymin': 0.6760070052539404},
  {'name': 'add to cart',
   'xmax': 0.6056338028169014,
   'xmin': 0.5107487027427724,
   'ymax': 0.8669001751313485,
   'ymin': 0.7933450087565674}],
 'screenshot': 'img716.jpg'}
If you pay close attention, the coordinates in the file were integers, not decimals. AutoML expects the numbers to be normalized to 1.
You can do that by dividing the numbers by either the width or height of the image.
#conver to float

                image_box = dict(name=name,

                                    xmin=max(0, float(xmin) / width),

                                    ymin=max(0, float(ymin) / height),

                                    xmax=max(0, float(xmax) / width),

                                    ymax=max(0, float(ymax) / height),

                )
Once we have the data structure with the right values, we can proceed to persist it to a CSV file with the expected format.
import csv
with open('screenshots.csv', "w") as csvfile:

  csvwriter = csv.writer(csvfile)

  for example in examples:

    for obj in example["objects"]:

      #expected format -> set,path,label,x_min,y_min,,,x_max,y_max,,

      csvwriter.writerow(["UNASSIGNED", f"gs://<bucket_name>/to_upload/{example['screenshot']}",

                          obj["name"],

                          obj["xmin"],

                          obj["ymin"],"", "",

                          obj["xmax"],

                          obj["ymax"], "", ""])
This generates a file like the following.
!head screeshots.csv
UNASSIGNED,gs://<bucket_name>/to_upload/img716.jpg,main product image,0.06745737583395107,0.6900175131348512,,,0.4351371386212009,1.0,,
UNASSIGNED,gs://<bucket_name>/to_upload/img716.jpg,price,0.5100074128984433,0.008756567425569177,,,0.5559673832468495,0.043782837127845885,,
UNASSIGNED,gs://<bucket_name>/to_upload/img716.jpg,add to wishlist,0.508524833209785,0.2714535901926445,,,0.5959970348406227,0.29422066549912435,,
UNASSIGNED,gs://<bucket_name>/to_upload/img716.jpg,quantity,0.508524833209785,0.5516637478108581,,,0.6404744255003706,0.6234676007005254,,
UNASSIGNED,gs://<bucket_name>/to_upload/img716.jpg,size,0.5070422535211268,0.6760070052539404,,,0.793180133432172,0.7408056042031523,,
UNASSIGNED,gs://<bucket_name>/to_upload/img716.jpg,add to cart,0.5107487027427724,0.7933450087565674,,,0.6056338028169014,0.8669001751313485,,
UNASSIGNED,gs://<bucket_name>/to_upload/img2093.jpg,main product image,0.09636767976278725,0.3134851138353765,,,0.44551519644180876,0.8581436077057794,,
UNASSIGNED,gs://<bucket_name>/to_upload/img2093.jpg,product name,0.5100074128984433,0.11208406304728546,,,0.8584136397331357,0.16112084063047286,,
UNASSIGNED,gs://<bucket_name>/to_upload/img2093.jpg,price,0.5107487027427724,0.18739054290718038,,,0.5922905856189771,0.2381786339754816,,
UNASSIGNED,gs://<bucket_name>/to_upload/img2093.jpg,quantity,0.5107487027427724,0.3607705779334501,,,0.5774647887323944,0.45183887915936954,,
It takes a little bit of work and a clear understanding of the concepts and process, but we are pretty much ready to train our predictive model.
Download the CSV to your computer and upload it to the Google Cloud Storage bucket.
from google.colab import files

files.download("screenshots.csv")
Training our Predictive Model in AutoML
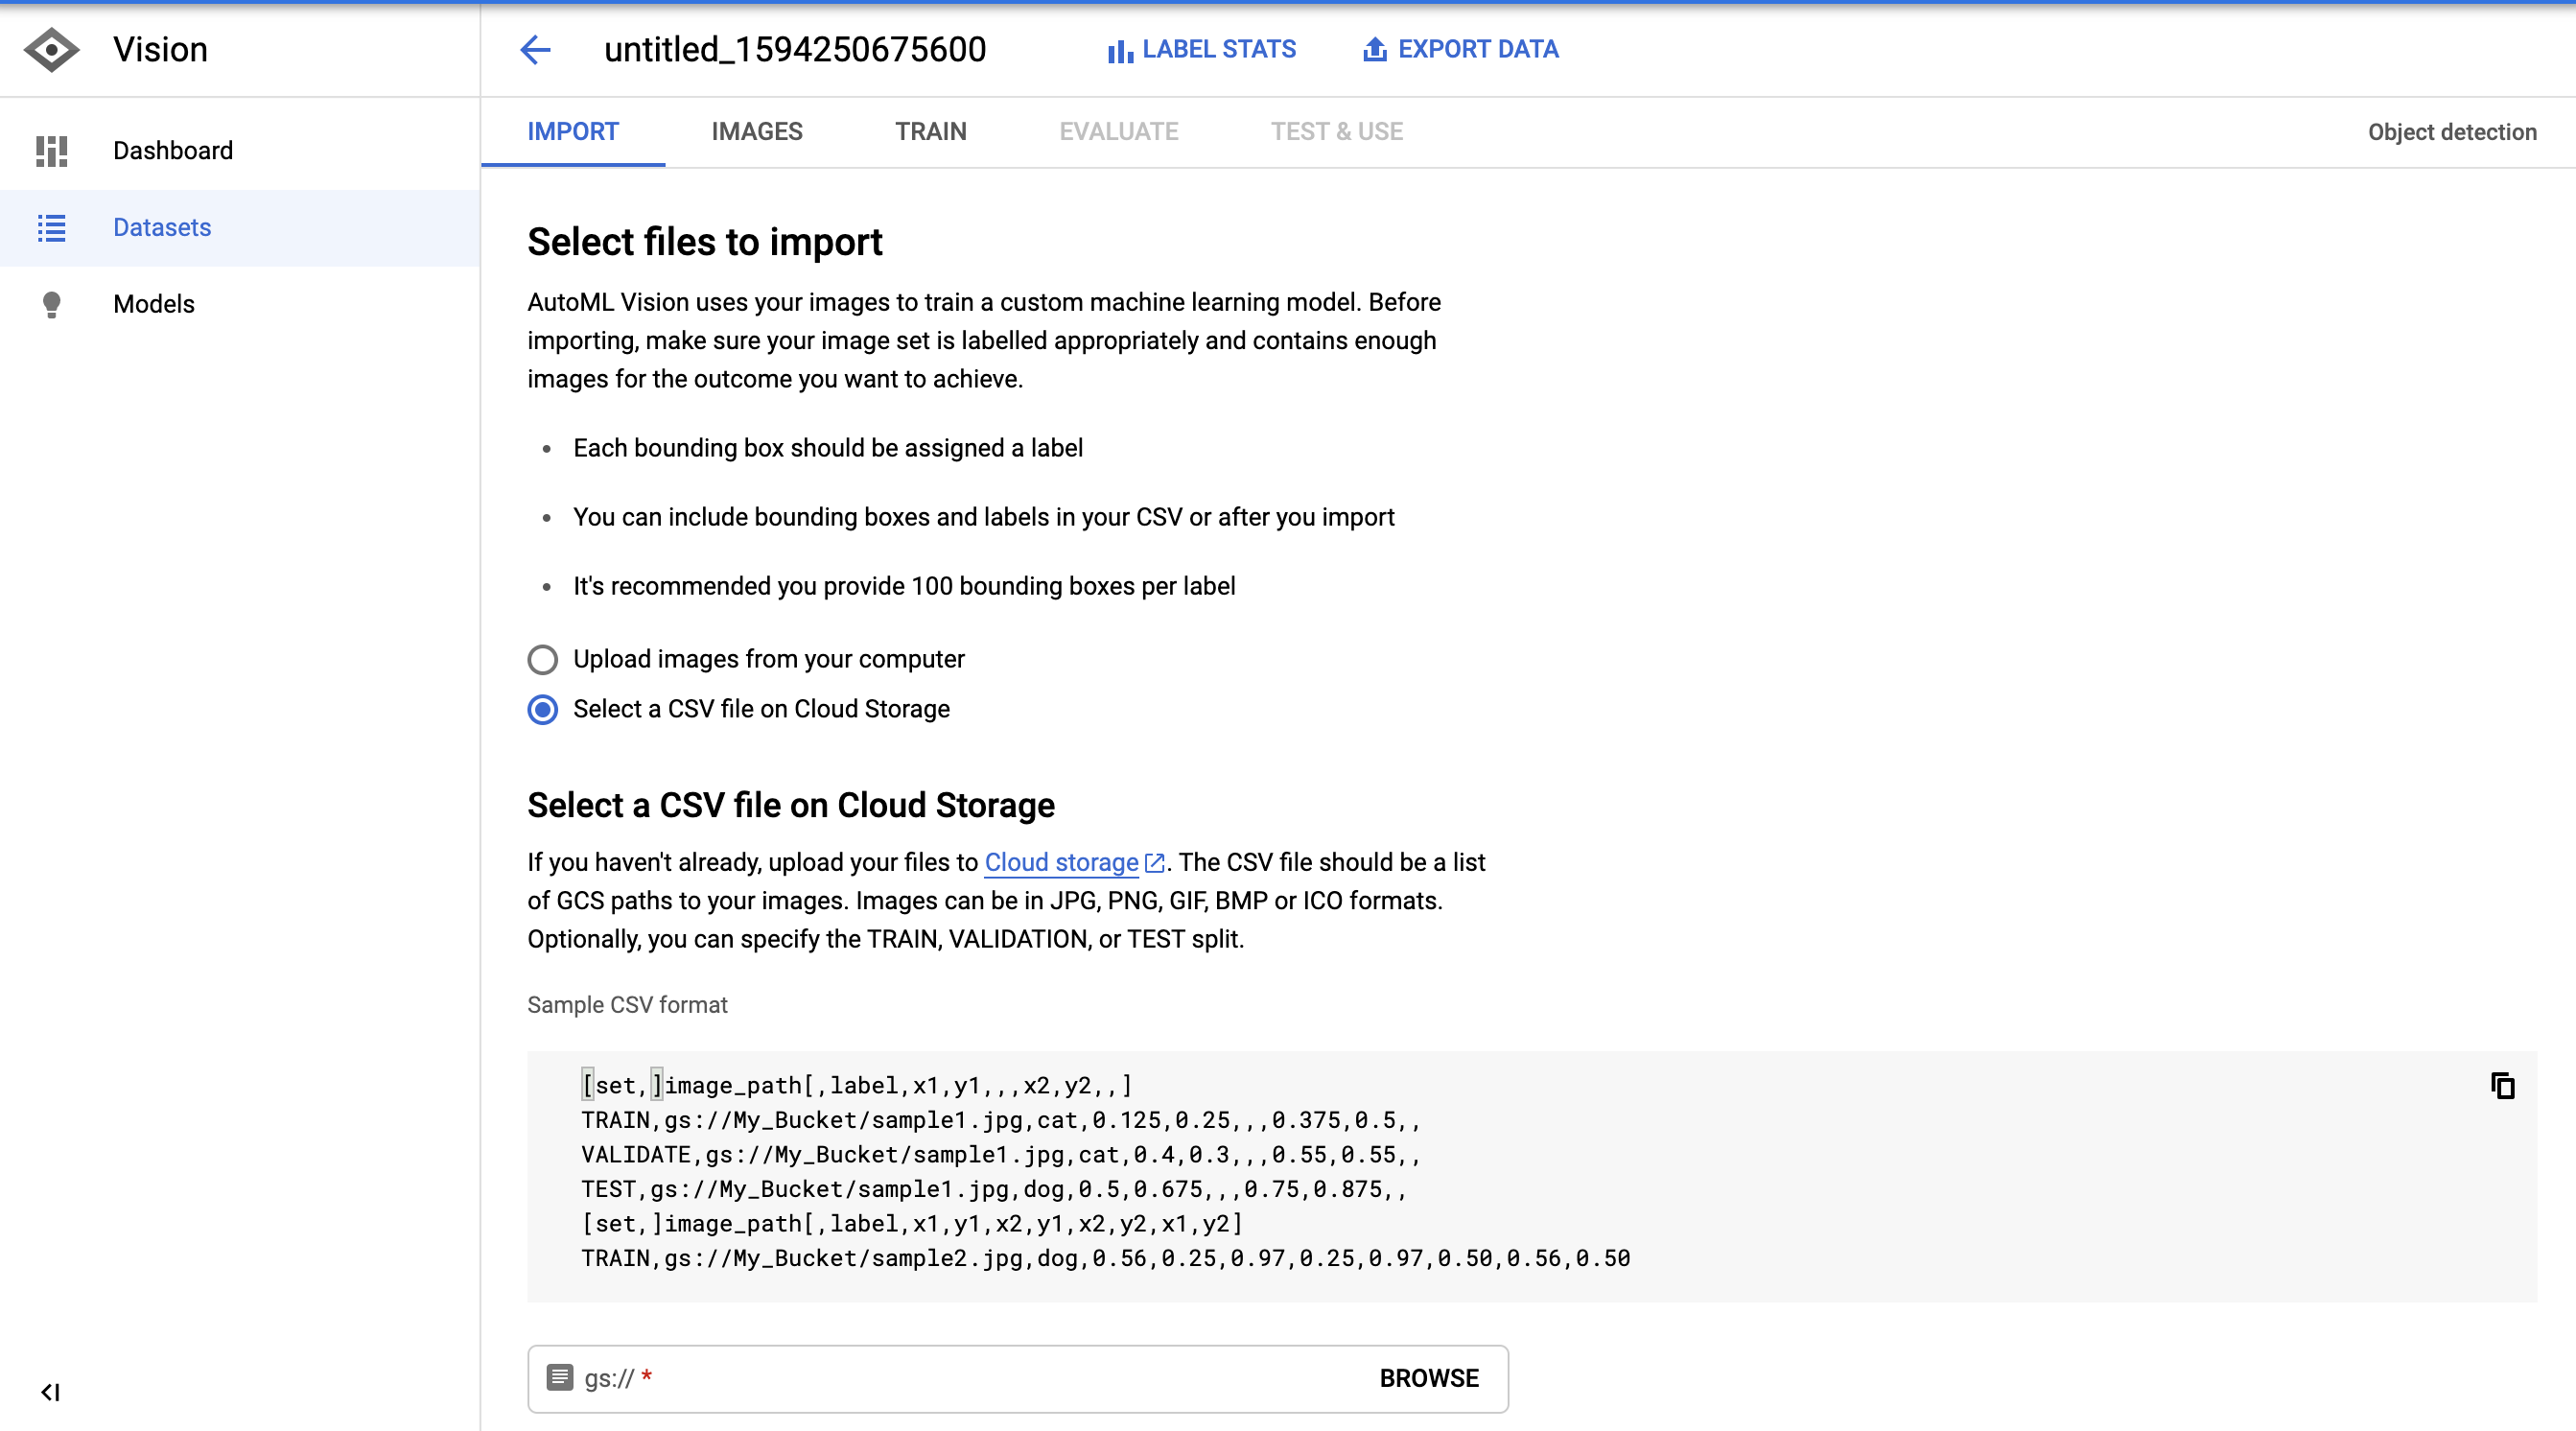
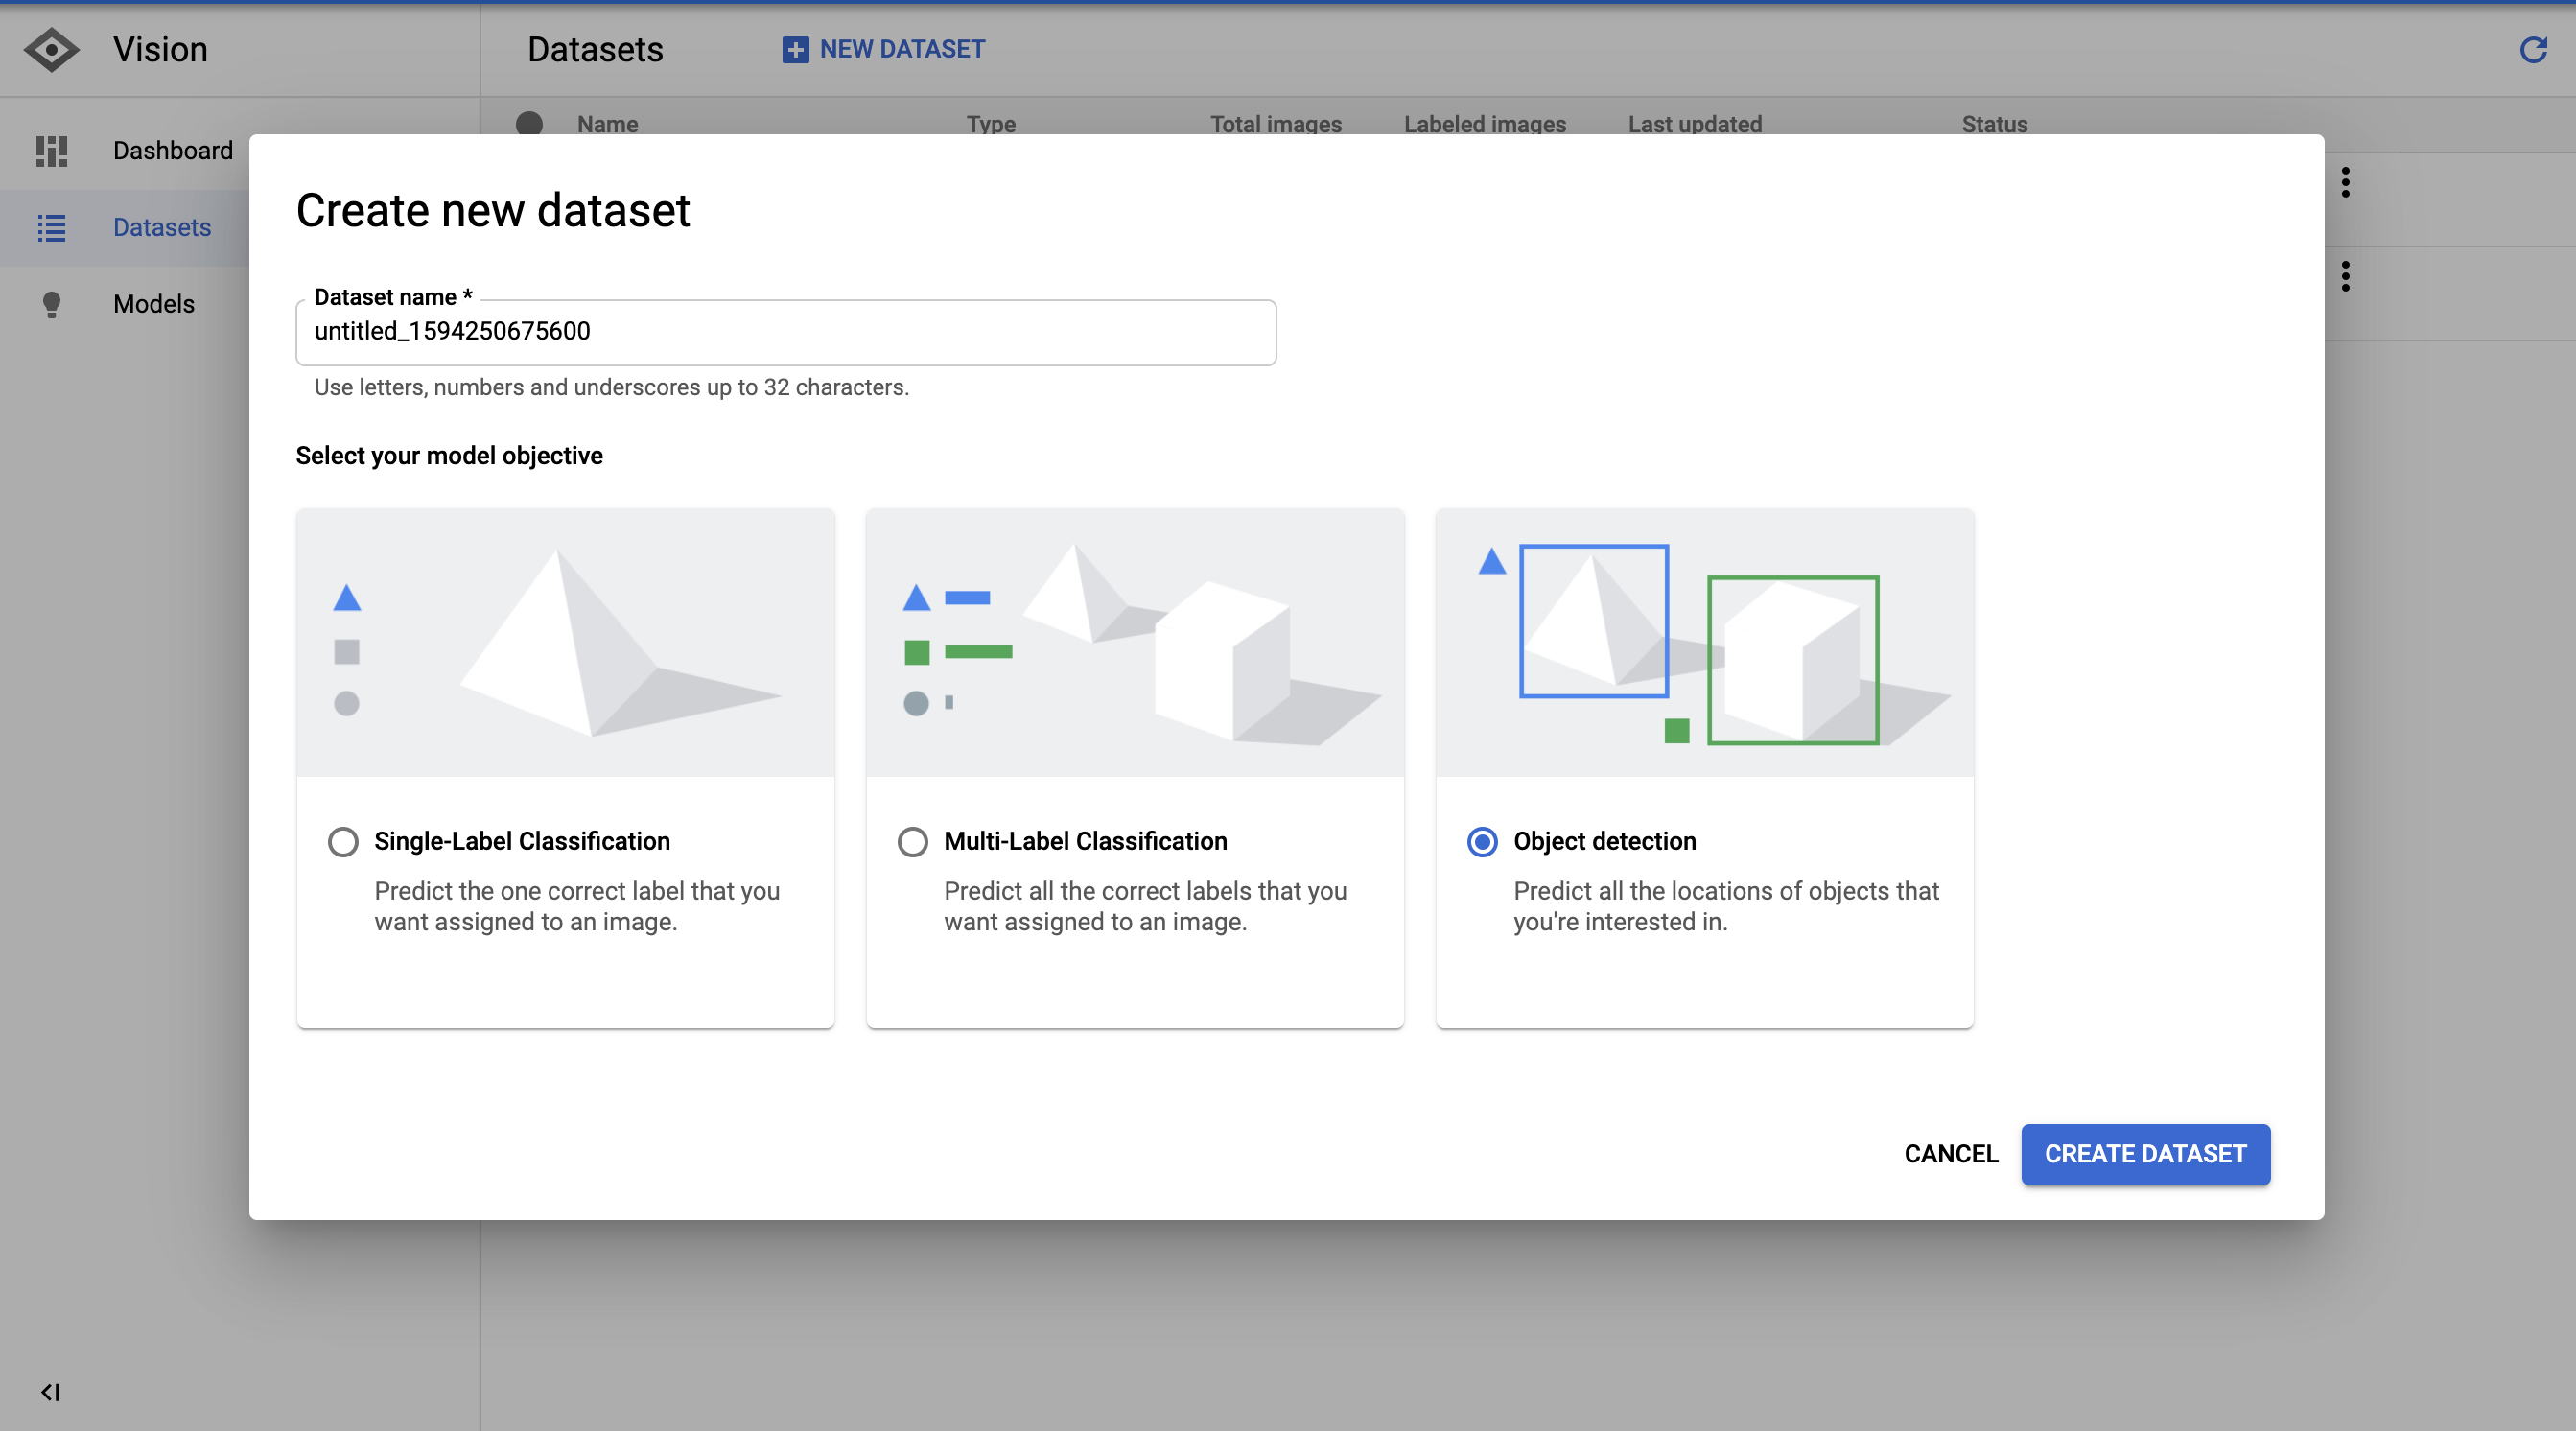
First, let’s create a new dataset to import our labeled images in Cloud Storage.
ADVERTISEMENT
CONTINUE READING BELOW
Next, we select the CSV we generated with the image paths, labels, and bounding box coordinates.
After we import the images, AutoML creates a really nice image browser that we can use to review the images and labels.
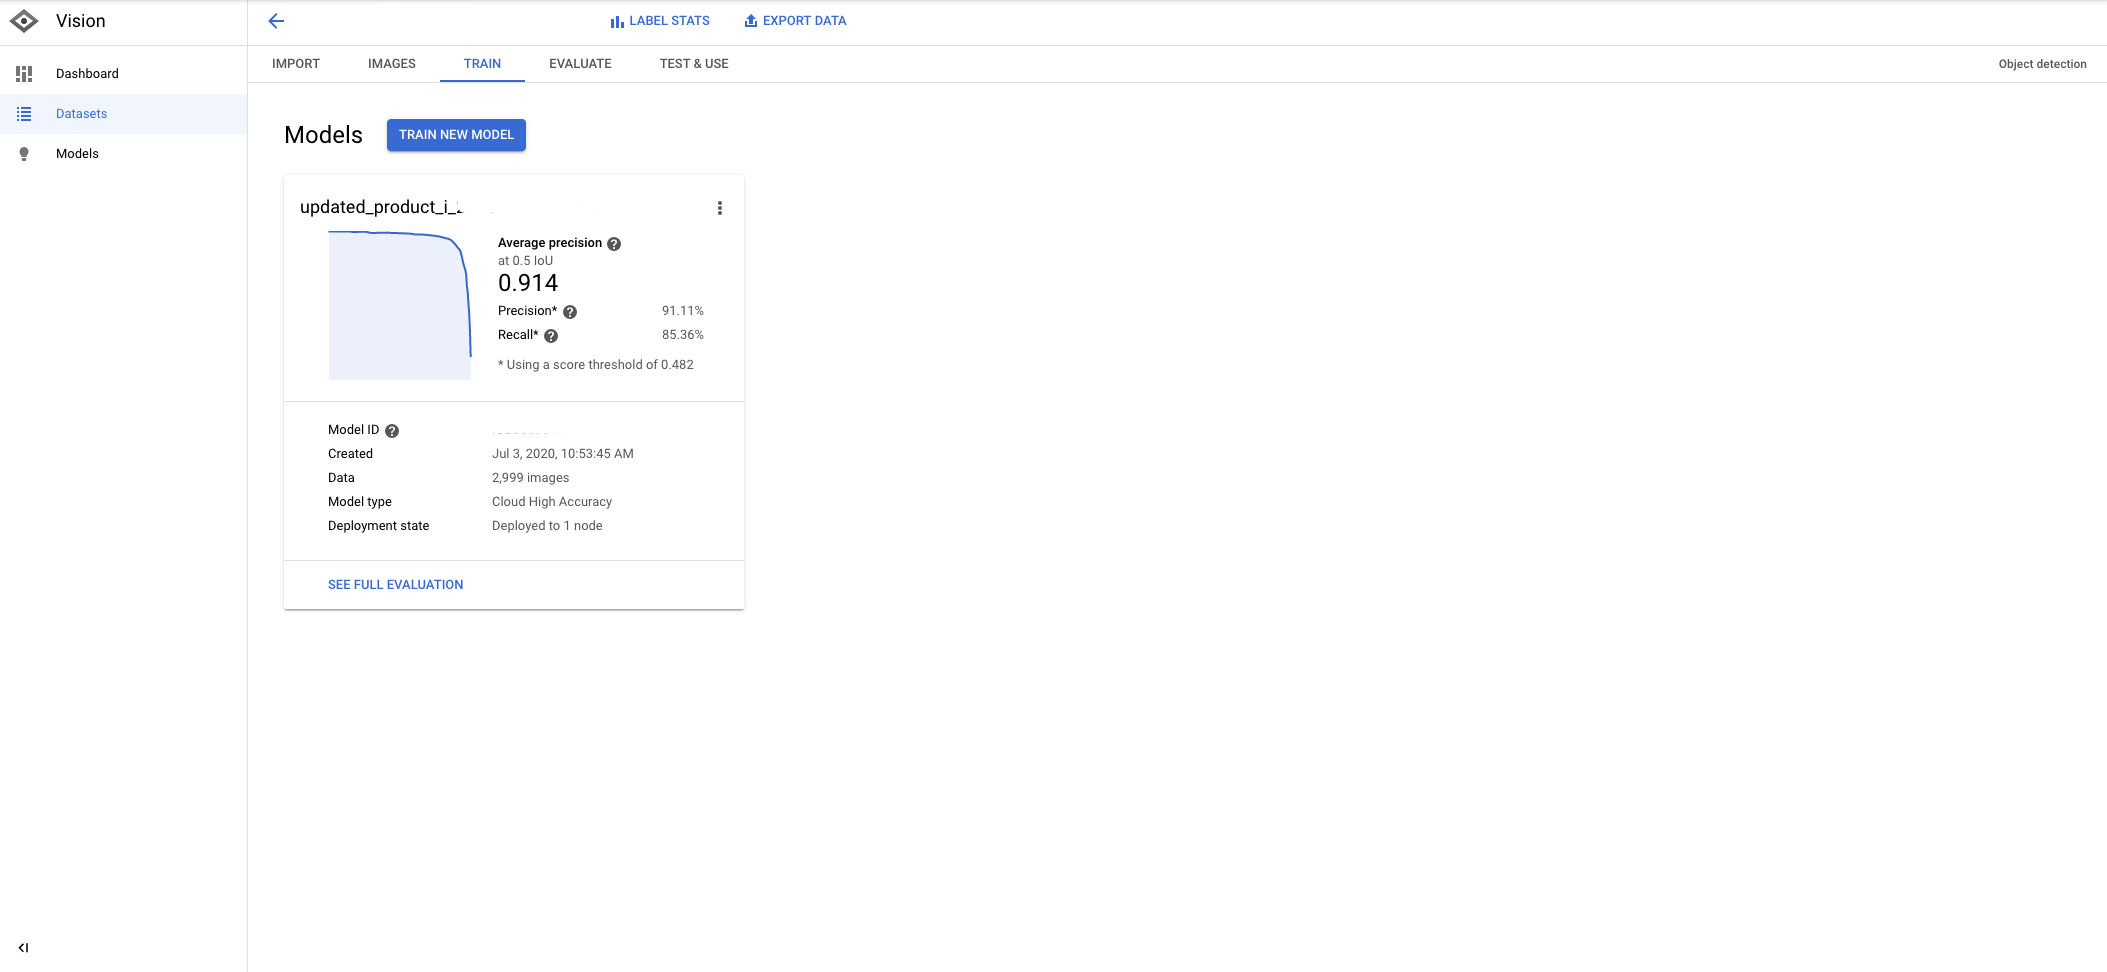
Finally, after we train the model for several hours, we get really high accuracy metrics.
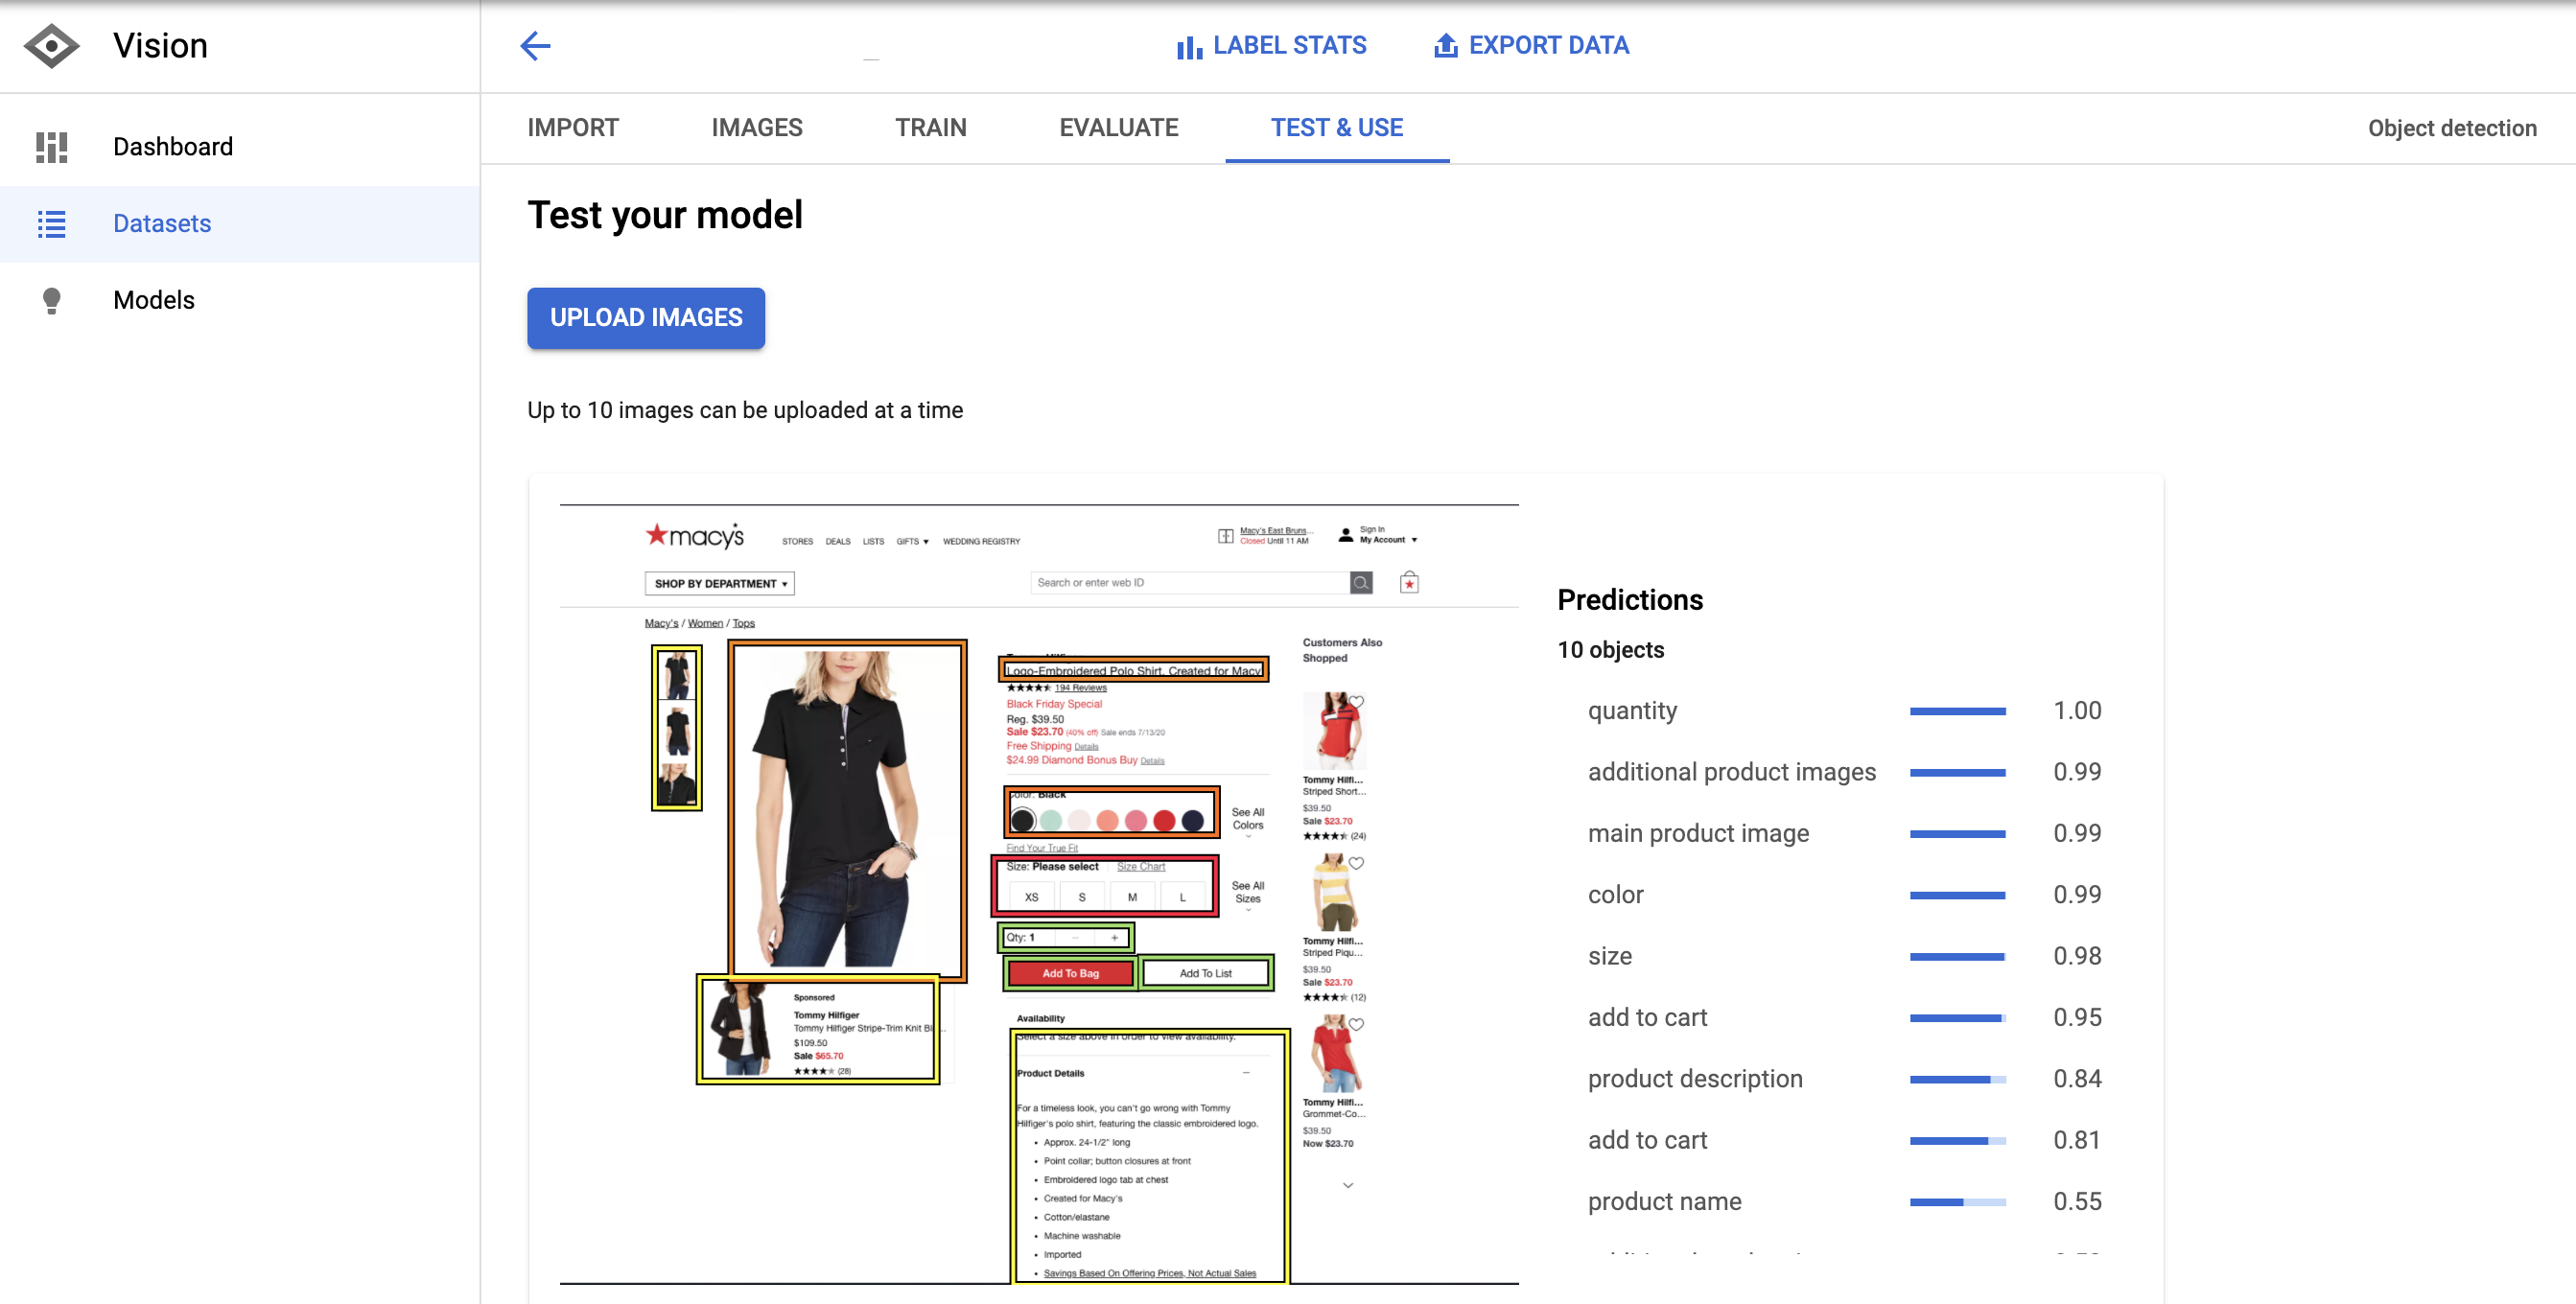
In order to test the model, I manually took a screenshot of a Macy’s product page and uploaded the image to the model prediction tool.
ADVERTISEMENT
CONTINUE READING BELOW
The predictions are exceptionally good. The model only missed the reviews and the price.
This means this example had high precision and low recall.
We can improve it by increasing the number of examples with labeled prices and reviews.
We have fewer reviews, but plenty of price examples. But, probably, this price doesn’t fit the existing patterns.
The next part is probably the most interesting.
How do we turn these bounding box coordinate predictions into structure data that we can inject into the HTML?
Turning Our Bounding Box Predictions into Structured Data
First, need to take screenshots automatically from Python. We can use Pyppeteer for that.
%%writefile get_product_shot.py

import asyncio

from pyppeteer import launch

async def main():

    url = "https://www.amazon.com/Kohler-Elongated-AquaPiston-Technology-Left-Hand/dp/B005E3KZOO"

    browser = await launch(executablePath="/usr/lib/chromium-browser/chromium-browser",args=['--no-sandbox'])

    page = await browser.newPage()

    await page.goto(url)

    await page.screenshot({'path': 'product_shot.png'})

    await browser.close()

asyncio.get_event_loop().run_until_complete(main())
In order to get this to work in Colab, we need to install chromedriver
!apt install chromium-chromedriver
Running async functions inside Jupyter or Colab can be a pain, so I prefer to run them as scripts.
ADVERTISEMENT
CONTINUE READING BELOW
%%bash

python get_product_shot.py
Now, that we have the screenshot, we can run a prediction on it.
This is the code to get predictions from our model.
import sys

import os

from google.cloud import automl_v1beta1

from google.cloud.automl_v1beta1.proto import service_pb2

os.environ["GOOGLE_APPLICATION_CREDENTIALS"] = "CHANGE-ME.json"

# 'content' is base-64-encoded image data.

def get_prediction(file_path, project_id, model_id):

  with open(file_path, 'rb') as ff:

    content = ff.read()

  prediction_client = automl_v1beta1.PredictionServiceClient()

  name = 'projects/{}/locations/us-central1/models/{}'.format(project_id, model_id)

  payload = {'image': {'image_bytes': content }}

  params = {}

  request = prediction_client.predict(name, payload, params)

  return request  # waits till request is returned
This code requires creating a service account with access to the AutoML service.
Generate a JSON file, upload it to Colab and change the code that says “CHANGE-ME.json” with the path name.
This line will generate the predictions from the screenshot we took.
ADVERTISEMENT
CONTINUE READING BELOW
response = get_prediction("img1996.jpg", <project_id>, <model_id>)
Let’s check our model predictions on the Amazon product page.
Look how the model was able to detect the product name even with the pop up partially obstructing it.
Pretty impressive!
In order to draw the boxes and labels, I created a function that takes the image file name and response from the AutoML model. You can find it in this gist.
Then just needed to call it with these lines.
img_with_boxes = draw_bounding_boxes("product_shot.png", response)
I also print the predictions we get back.
Predicted label and score: additional product images 99.40%
Predicted x1, y1: (62, 450)
Predicted x2, y2: (300, 495)
Predicted label and score: product description 98.80%
Predicted x1, y1: (364, 373)
Predicted x2, y2: (694, 600)
Predicted label and score: product name 94.47%
Predicted x1, y1: (369, 180)
Predicted x2, y2: (696, 283)
Predicted label and score: main product image 90.14%
Predicted x1, y1: (86, 247)
Predicted x2, y2: (284, 432)
Then, we can visualize them here.
from google.colab.patches import cv2_imshow

cv2_imshow(img_with_boxes)
Now we get to the tricky part.
Let’s use the predicted coordinates of the product description, highlighted in bold above.
I want to calculate a point right in the middle of the bounding box. We can do that using:
x1, y1 = (364, 373)

x2, y2 = (694, 600)
x, y = ( int((x1 + x2) / 2), ( int((y1+y2) / 2)))
print(x, y) -> (529, 486)
We can identify the HTML DOM element in JavaScript that appears in these coordinates.
ADVERTISEMENT
CONTINUE READING BELOW
Here is the code with the coordinate values hard-coded (in bold).
%%writefile get_element_box.py

import asyncio

from pyppeteer import launch

async def main():

    url = "https://www.amazon.com/Kohler-Elongated-AquaPiston-Technology-Left-Hand/dp/B005E3KZOO"

    browser = await launch(executablePath="/usr/lib/chromium-browser/chromium-browser",args=['--no-sandbox'])

    page = await browser.newPage()

    await page.goto(url)

    await page.screenshot({'path': 'product_shot.png'})

    output = await page.evaluate('''() => {

        var el = document.elementFromPoint(529, 486); //document.querySelector("#productTitle");

        var coords = el.getBoundingClientRect();

        return {

            x: coords.left,

            y: coords.bottom,

            tag: el.tagName,

            text: el.innerText,

            width: document.documentElement.clientWidth,

            height: document.documentElement.clientHeight,

            deviceScaleFactor: window.devicePixelRatio,

        }

    }''')

    await browser.close()

    print(output)

asyncio.get_event_loop().run_until_complete(main())
I’m injecting and executing a custom JavaScript function when pyppeteer loads the page.
The function selects the element by the coordinates we calculated and returns its tag name and inner text among other attributes.
Here is what the output looks like when we run the script:
{'x': 383.03125, 'y': 519, 'tag': 'SPAN', 'text': 'Compact elongated bowl offers added comfort while occupying the same space as a round-front bowl', 'width': 800, 'height': 600, 'deviceScaleFactor': 1}
If you look a the image above, it is the bullet item right in the middle of the description.
In practice, we use some extra logic to find the parent element with the biggest surface overlap so we can capture the full description in cases like this.
Finally, let’s see what the output looks like when we pass the predicted product name coordinates.
{'x': 363.59375, 'y': 280, 'tag': 'SPAN', 'text': 'Kohler 3811-0 Santa Rosa Comfort Height Elongated 1.6 GPF Toilet with AquaPiston Flush Technology and Left-Hand Trip Lever, White', 'width': 800, 'height': 600, 'deviceScaleFactor': 1}
We were able to capture the full product name very precisely!
Here is your homework: update the code so you can return the text from all the predicted bounding boxes with the corresponding labels.
Resources to Learn More
We started a new weekly series of Python tutorials focused on practical SEO building blocks for beginners.
ADVERTISEMENT
CONTINUE READING BELOW
I am mentoring a couple of interns that help with our technical support and they are the ones putting together the Colab notebooks as they learn.
Make sure to check them out and try to follow the steps and complete the homework assignments!
More Resources:
Image Credits
All screenshots taken by author, July 2020
read more at https://www.searchenginejournal.com by Hamlet Batista
Digital marketing


