
It’s been five years since I published the first in We Are Social’s series of Global Digital reports, so I thought it might be interesting to see how much things have changed in that time.
When I started looking back at the numbers, though, I got a big shock; things have been growing much faster than I thought.
Ever been to a tech festival?
TNW Conference won best European Event 2016 for our festival vibe. See what’s in store for 2017.
The Headlines
You’ll find the year-by-year story below, but first, let’s look at the 5-year picture:
- Internet users have grown by 82%, or almost 1.7 billion people, since January 2012. That translates to almost 1 million new users each day, or more than 10 new users every second;
- More than 1.3 billion people started using social media – that’s a rise of 88% in just five years, and equates to more than 8 new users every second;
- The number of mobile connections in use grew by a whopping 2.2 billion, meaning that operators activated a net average of almost 14 new subscriptions every second to deliver growth of 37%;
- We’ve only been publishing mobile social media user numbers since January 2015, but users have grown by more than 50% in those two years alone. More than 864 million people have started using social platforms via a mobile device in the past 24 months, at a rate of almost 14 new users every second.
These numbers are quite impressive, but things get more interesting when we dig into the individual annual reports.
Social, Digital, and Mobile Worldwide in 2012
At just 16 slides, our first global report in January 2012 was a lot shorter than recent editions (especially compared to this year’s 3,300 slides), and I didn’t have much to say in my introductory blog post either.
Despite the brevity, the data still makes for interesting reading today though. The key finding from the 2012 report was that the number of internet users around the world had just passed the 2 billion mark. That milestone seemed incredible at the time, especially considering that the internet was barely 20 years old.

However, looking back at it now, it seems surprising that barely three people in every ten around the world used the internet just five years ago. What’s more, just 22% of the world’s population – or just less than 1.5 billion people – were using social media each month.
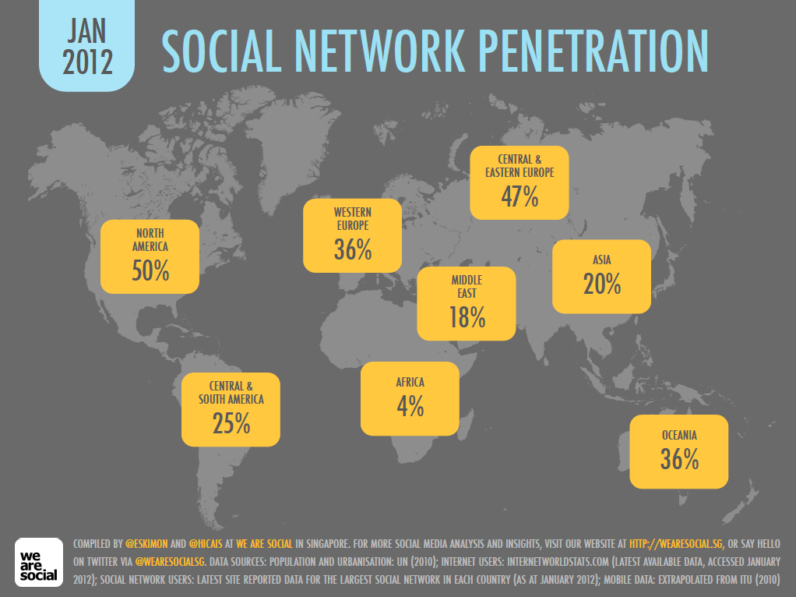
There were already close to 6 billion active mobile subscriptions in use at the time, though, which equated to roughly 86% of the world’s population (we’ve since learned not to refer to that as ‘penetration’ though; once the ratio passed 100%, we got lots of queries as to how ‘penetration’ could exceed 100%).

A quick look at the regional picture makes for even more interesting reading. With 921 million people in Asia using the internet back in 2012, penetration stood at less than 25%, but more than three-quarters of North Americans – or 266 million people – were already online.
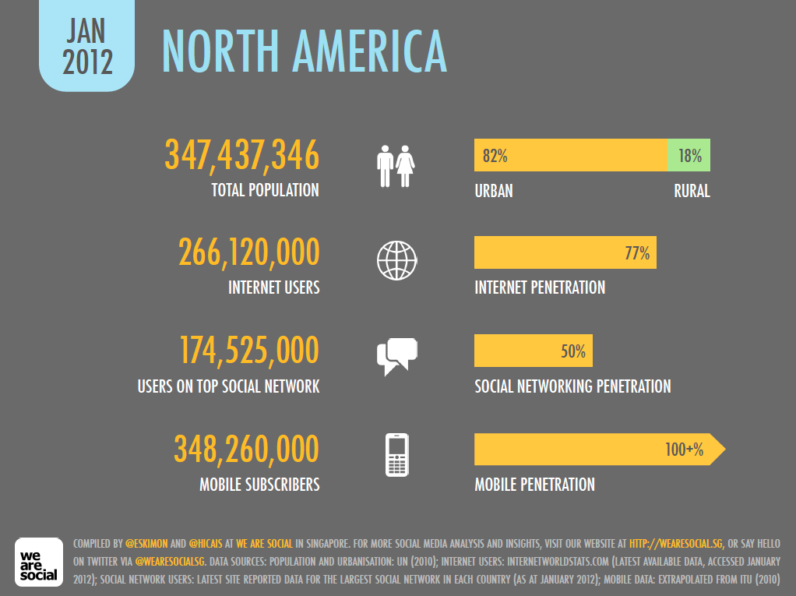
Half of North America’s population were already ‘social’ too, with 175 million people using Facebook each month. However, social media penetration in Asia stood at just 20%, with just over 750 million people accessing social platforms each month.
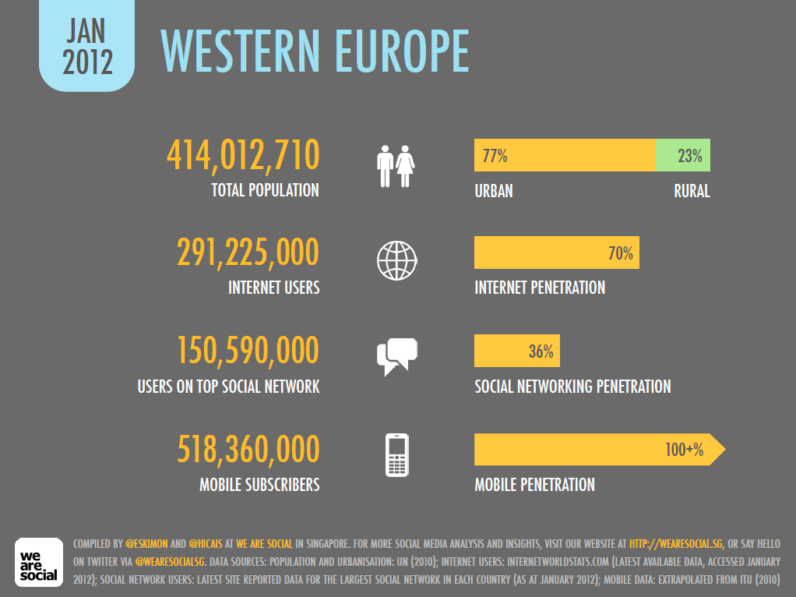
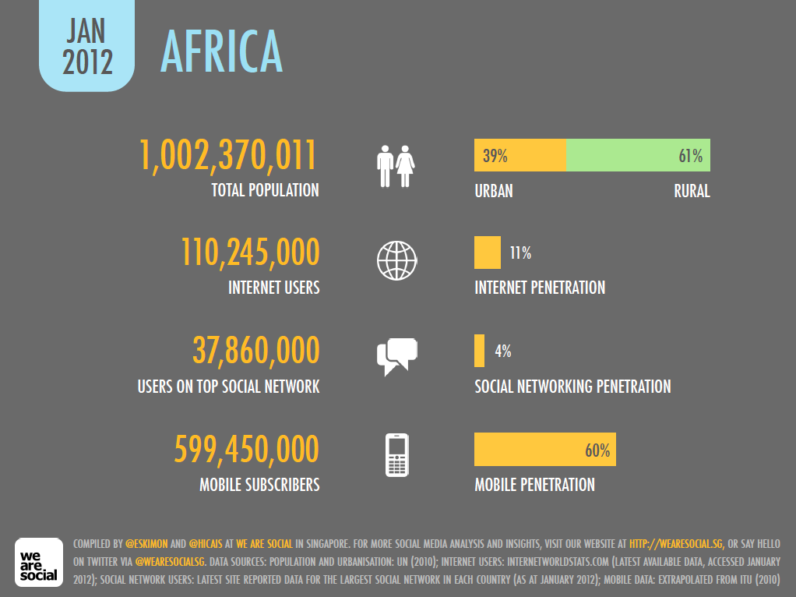
By early 2012, nearly 300 million people in Western Europe were using the internet, with just over half of these using social media each month. However, just 11% of Africa’s population was online, with barely 1 person in every 25 across the continent using social media each month.
Social, Digital, and Mobile Worldwide – 2013 Edition
The scale of the 2013 report didn’t change much, but its 16 slides of global overviews adopted a slightly different format:
The numbers within the report had changed considerably though, with an additional quarter of a billion people coming online in the previous twelve months to take global internet penetration to one-third of the planet’s total population.
As I noted in our analysis of that year’s report, we were heartened to see that much of this growth had come from developing nations, with Asia contributing a significant proportion of all new users.
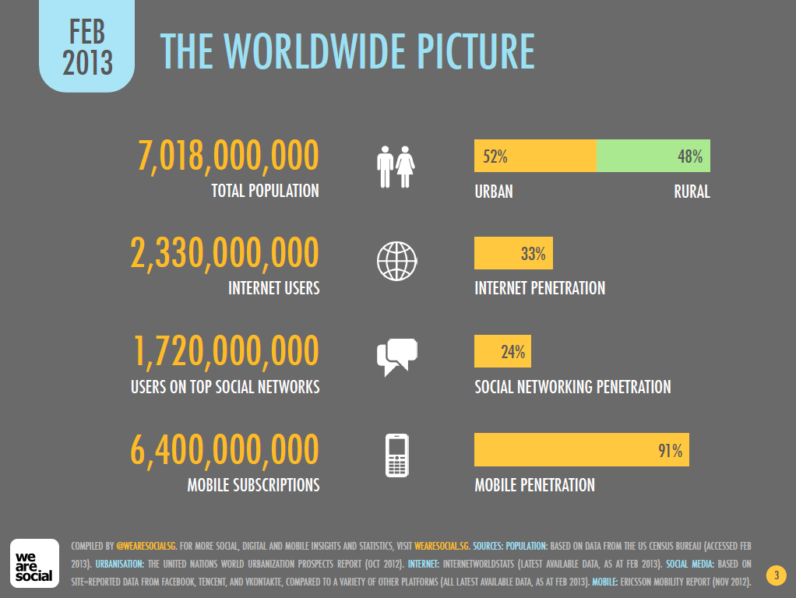
Reaching 33% internet penetration seemed like a milestone worth celebrating at the time, and with growth accelerating all over the world, it looked like 2013 would be another year of stellar digital growth too.

Global social media penetration hadn’t quite reached the 25% mark by the time of publication, but with 650,000 people using social media for the first time every day throughout 2012 – a growth rate of 7.5 new users every second – social media was very much on the up.

Individual social media platform data gave cause for optimism, too; Facebook’s global user base was rapidly approaching one billion MAUs (monthly active users), and China’s social media landscape was undergoing a period of significant change.
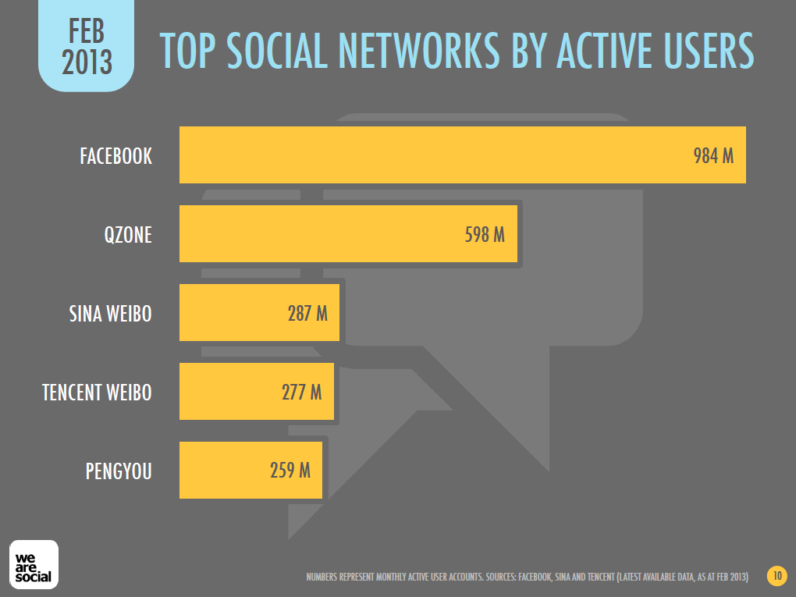
China already boasted the largest number of social media users of any country in the world, but the behavior of these users was evolving rapidly, with both Sina Weibo and Tencent Weibo growing their user bases by more than 100 million active accounts in the 12 months leading up to this report.
It’s worth noting that when we published this report (just four years ago), WeChat had only been around for a few months, and still didn’t even factor in China’s top 4 platforms.
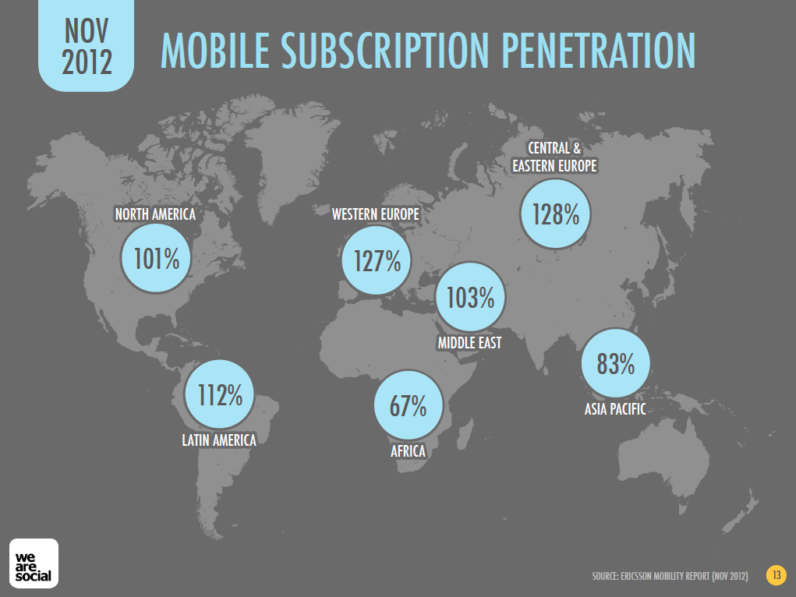
Meanwhile, the number of mobile subscriptions in use around the world had surged by 530 million in the previous 12 months – a rate equivalent to more than 16 new subscriptions every second – with active mobile connections then equating to 91% of the world’s total population.
Global Digital Statistics 2014
We Are Social went through a re-brand at the end of 2013, so our 2014 report reflected our new style. The numbers had gone through plenty of changes of their own too, with all key indicators posting strong growth through 2013:
However, the pace of changed seemed to be slowing in comparison to the rates we’d seen in the 2013 report. Global internet penetration had grown to 35% by January 2014, but with just (!) 150 million new users in the previous 12 months, internet user growth was 40% slower than the year before.

Social media growth had slowed too, although the number of active accounts across the world’s top accounts had risen by more than 130 million new users during the preceding 12 months. Social media penetration had also passed one-quarter of the world’s population, which – at the time – seemed like a significant milestone.

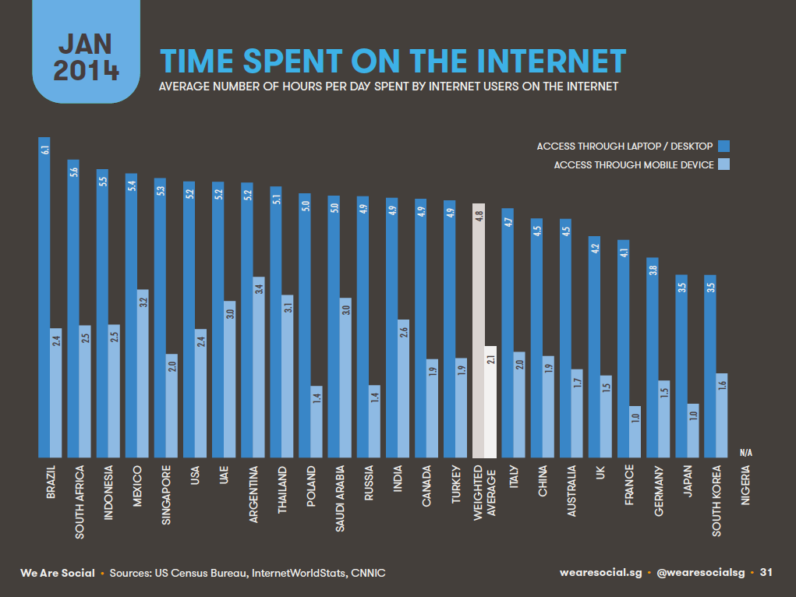
Internet penetration in North America had passed 80%, but most regions around the world still languished well below 50% penetration. People were spending more time using the internet though, and we were particularly interested in GlobalWebIndex‘s data that allowed us to compare the time spent on mobile internet versus internet access via a desktop or laptop:
When we published our 2014 report, social media penetration had only passed 50% in North America, with penetration levels in the rest of the world still well below the halfway mark.
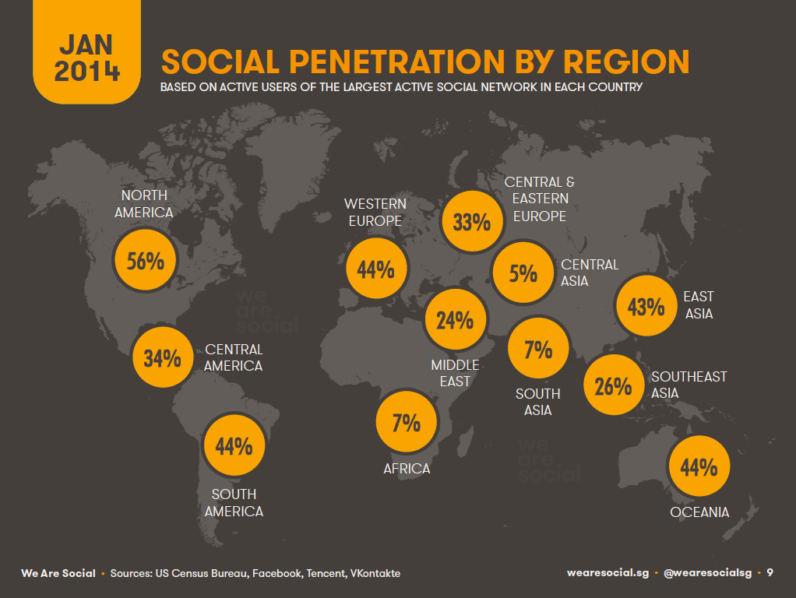
There was plenty of evolution in the social platform rankings though, with the biggest change being the rapid rise of WeChat since the year before. It’s also worth noting that WhatsApp – already in fourth position in the global user rankings by January 2014 – ‘only’ had 400 million users in January 2015 (i.e. 3 years ago). Given the platform’s standing today, it’s staggering to think just how quickly the world’s favorite messenger platform has grown.

As part of the wealth of new data points we included in the 2014 report, one of the most interesting was mobile broadband access. It’s not a metric that we talk about a lot in our annual analysis, but it’s a reliable indicator of potential future growth. As broadband connectivity improves, so access to mobile internet services improves, so when we see a meaningful increase in broadband penetration, it’s likely that we’ll see a corresponding uplift in internet use over the following months too.

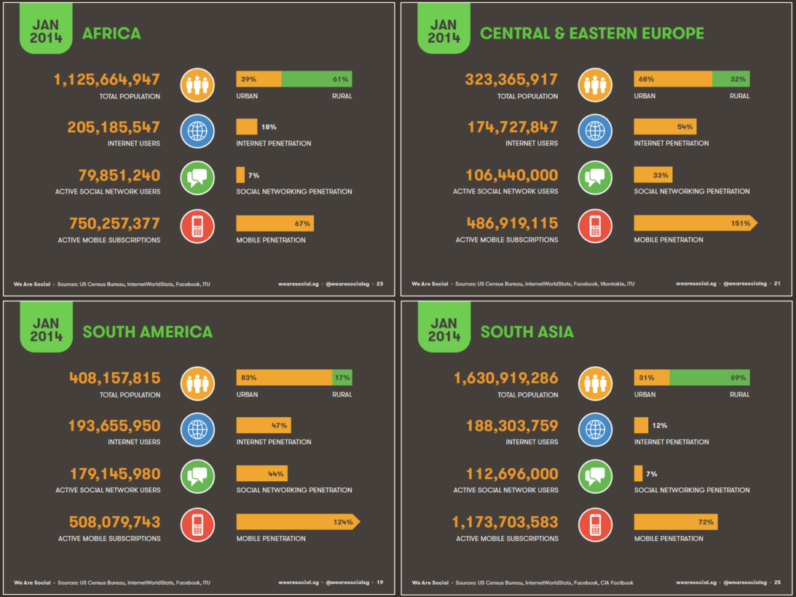
We offered regional snapshots again in the 2014 report too, allowing for some interesting comparisons between different parts of the world:
Digital, Social & Mobile in 2015
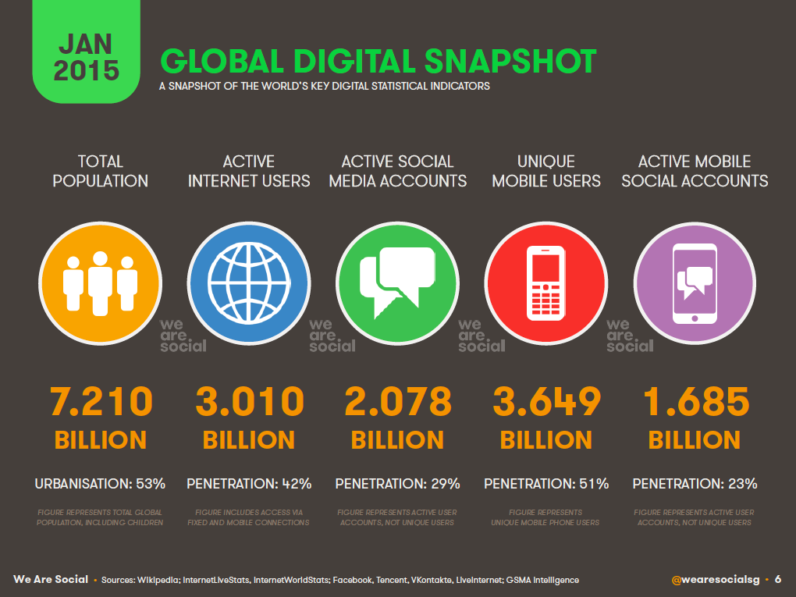
The pace of global digital growth had quickened again by January 2015, with all key indicators up considerably versus 2014.
In particular, the number of internet users around the world had grown by 21% year-on-year, with well over half a billion users coming online for the first time during the course of 2014. That’s more than 1.4 million new users every day, or 20 new users every second.

This took the total number of global internet users past the 3 billion mark – a milestone we revealed to the world for the first time in a special post just a few weeks before we published the full 2015 report.
Within my analysis post for our 2015 report, I also made the prediction that,
Based on the trends within this data, we expect that mobile will help to push internet penetration beyond 50% of the world’s population during mid to late 2016.
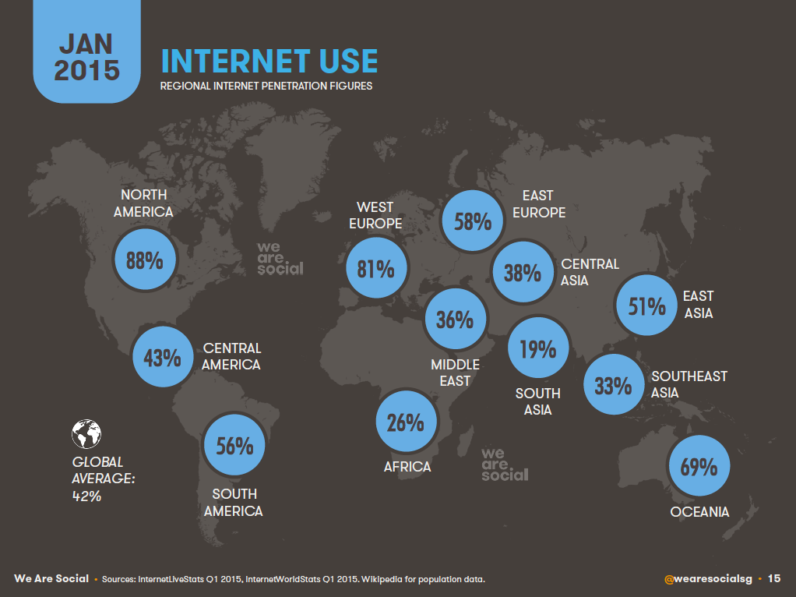
Fortunately, that prediction turned out to be spot on, as our Digital in 2017 report from last month shows (see below). A number of regions around the world had also passed the 50% penetration mark during the course of 2014, most notably East Asia (which includes China).
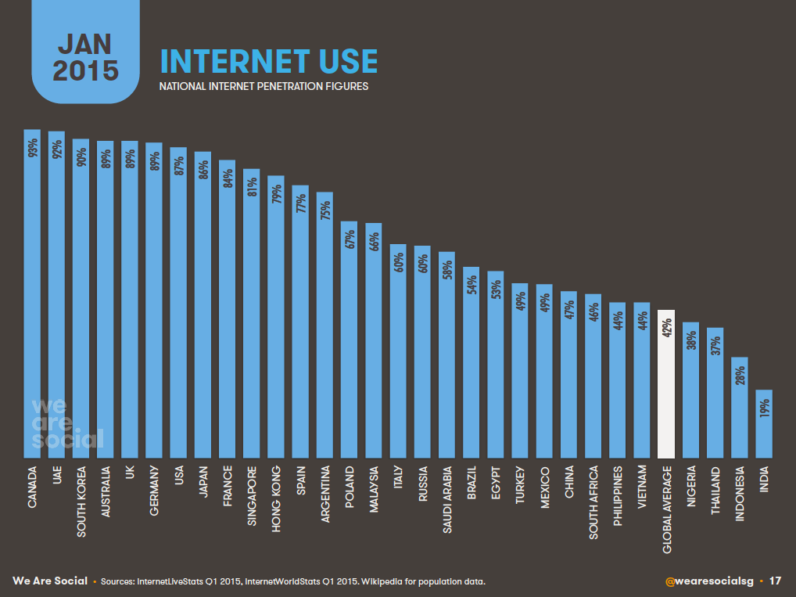
However, internet penetration in the world’s most populous region – South Asia – still struggled below the 20% mark, with India in particular recording disappointingly low levels of internet access across the country’s population of more than a billion people.
The variations in internet penetration across the world’s top economies were quite revealing too, with most of the world’s larger countries appearing in the lower positions of that year’s comparison chart:
Given the data we reported in this year’s 2017 report, it’s probably also worth highlighting that more than 60% of the world’s web traffic still originated from PCs in January 2015, with mobile phones accounting for just 31% of the world’s total web traffic.

Social media user numbers had increased by double digits around the world in the 12 months to January 2015, with the number of people using the top social media platform in each country passing the 2 billion mark in August 2014 – another big milestone that we covered in this dedicated post.
The distribution of social media users around the world remained uneven though, with many regions still suffering from single-digit penetration levels.

As had become a trend by this point, the top global social platform rankings had seen some interesting changes over the previous year, with the separation of Facebook Messenger into its own standalone app allowing Mark Zuckerberg and co. to add another one of their properties to the world’s most active social platform rankings. WeChat use was up to, although it was still considerably behind its Tencent stablemates, QQ and QZone.

People were spending more and more time on social media too, as evidenced by the latest data from GlobalWebIndex, which showed that Argentinians and Filipinos both spent more than 4 hours each day using social media.

Mobile social media was the big growth story of the year though, with the number of users accessing social media via mobile devices up by 23% year-on-year.
Despite this rapid growth, mobile social penetration around the world was still below 25% though, and – as with so many other areas of digital use – its distribution was still highly inconsistent from one region to the next.

Mobile had passed a significant milestone of its own by the time we published the 2015 report, with more than half the world now using a mobile phone. We’d broken this story a few months before in another dedicated post, but considering the penetration levels we’ve just reported in our Digital in 2017 report, it’s hard to think that we only passed the 50% mark a little over two years ago.
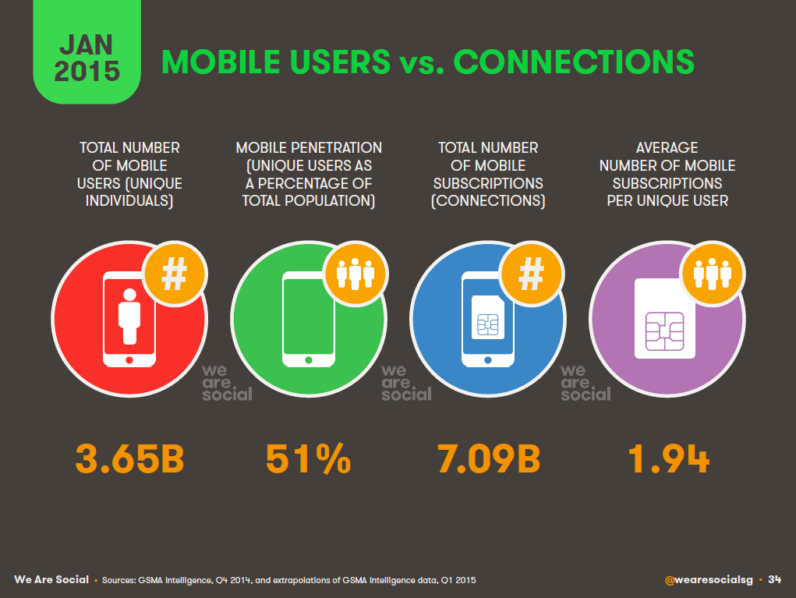
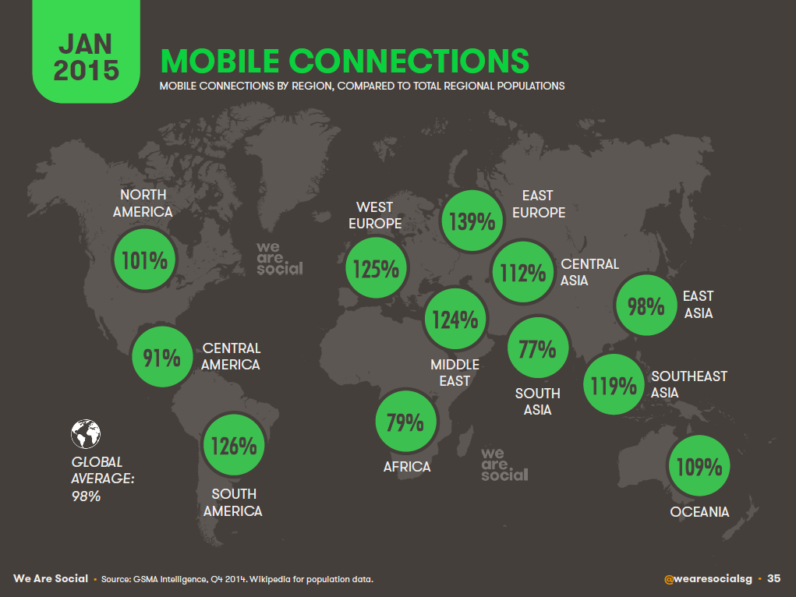
Mobile connectivity was just as varied as internet and social media use though, with the number of connections in some regions well in excess of total population (due to the use of multiple SIMs and handsets by the same individual), whilst other still hadn’t reached 100% penetration.
Smartphones were already becoming an important feature of the mobile landscape around the world though, with well over one-third of all active mobile connections running on a smartphone device by January 2015.

Another finding from our 2015 report that shows just how quickly things continue to evolve relates to the use of the internet on mobile devices. Just two years ago, Apple’s iOS accounted for the lion’s share of mobile internet traffic, and platforms other than iOS and Android accounted for almost one-third of all mobile web browser traffic. If you compare these figures to the same data points in our 2017 report, though, you may get a surprise.

Digital in 2016
Plenty had changed again by the time we released last year’s Digital in 2016 report, with internet, social media, and mobile social all posting double-digit growth over the previous twelve months.
The number of internet users had grown by 332 million since January 2015, meaning that an average of just under 1 million new users came online every day in the year leading up to this report. That equates to more than 10 new users every second in 2015.

There were fewer big milestones to report in 2016, but in my analysis of last year’s numbers, I was excited to predict that mobile social users would pass the 2 billion mark within the coming months (which, as we now know, they did).
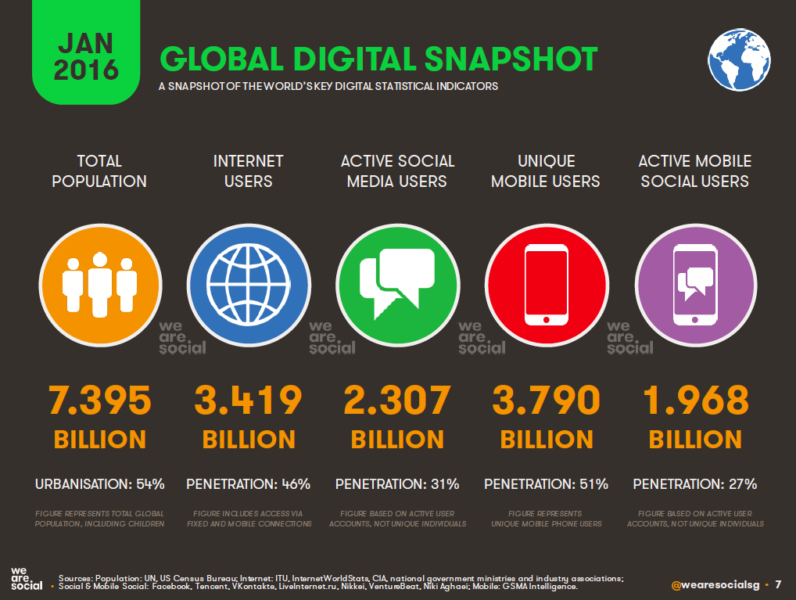
Global internet penetration had reached 46% by January 2016, with more than 3.4 billion people around the world using the internet by the time we published this report. Many regions still struggled with low penetration figures though, particularly South Asia, where internet use was still restricted to fewer than 3 in 10 people.
However, South Asia had posted relative year-on-year growth in internet users of more than 50% compared to the year before, and this accelerating growth gave us cause for considerable optimism.
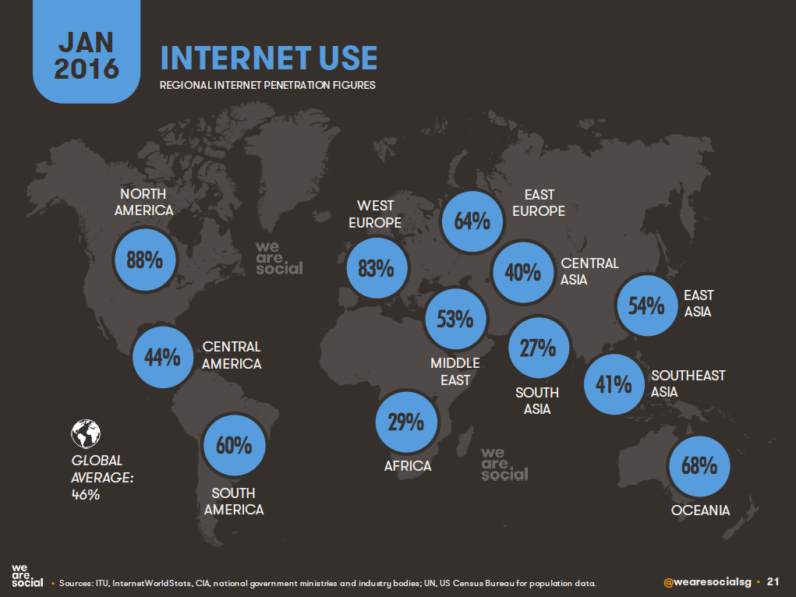
India still struggled in last place in our ranking of the 30 ‘key global economies’ though, well behind the global average, and delivering a considerable dampener to the overall Asia-Pacific penetration figure.
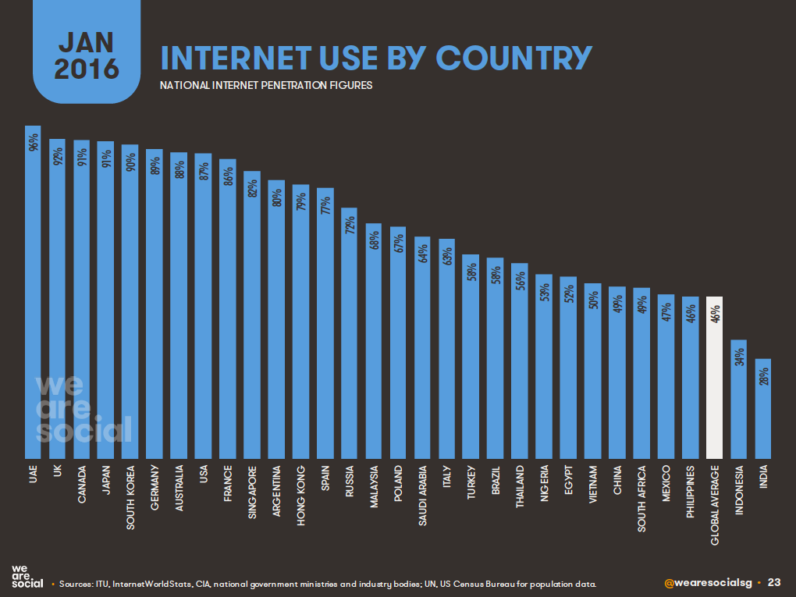
India certainly didn’t have the lowest penetration in the world, though; that distinction went to North Korea, where just 0.03% of the country’s population had access to the internet this time last year. At the other end of the scale, Iceland led the global rankings, with national internet penetration reported as 98%.

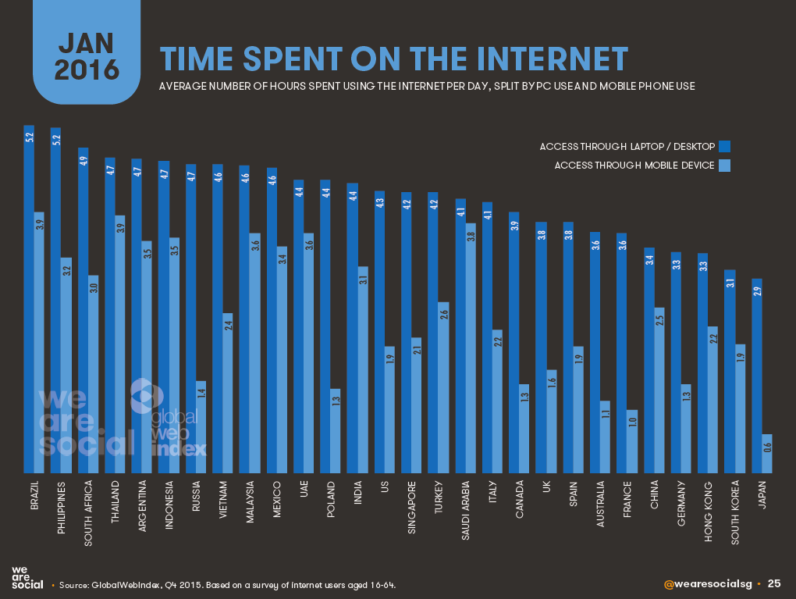
The amount of time people spent on the internet in the last quarter of 2015 was up considerably versus the same time two years previously too, with the time spent using the internet via mobile devices more than doubling across many of the countries in our study.
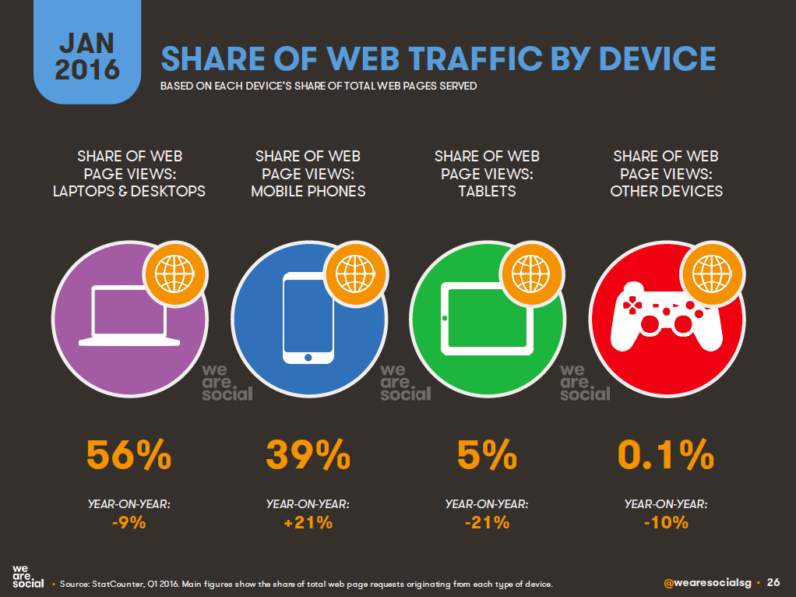
Interestingly, laptop and desktop computers still accounted for 56% of all web traffic this time last year, with mobile phones only responsible for 4 in 10 of all web pages served to web browsers around the world.
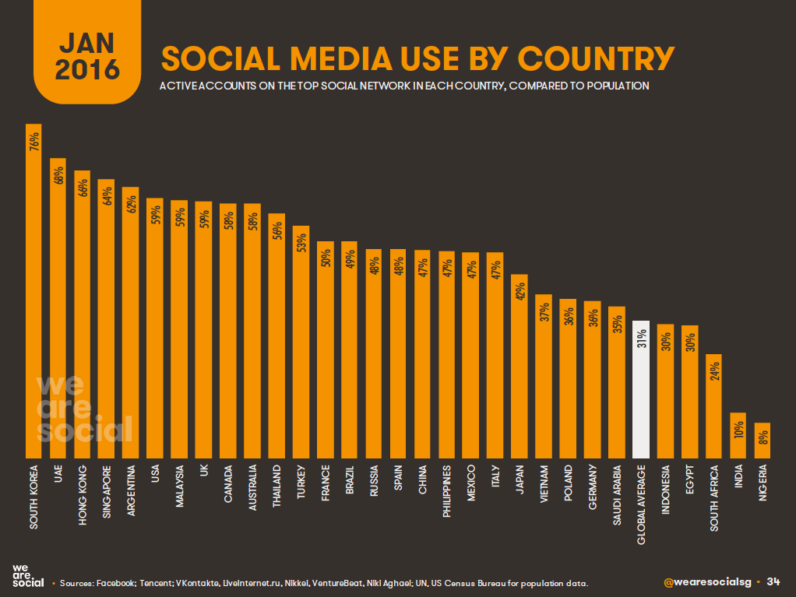
Just 12 months ago, global social media penetration sat at 31%, with mobile social media use at 27%. Social media users numbered more than 2.3 billion, but mobile social still hadn’t quite reached the 2 billion mark despite 17% year-on-year growth.

Nigeria recorded the lowest levels of social media penetration across our 30 key economies at just 8% of the country’s population, with India only just ahead on 10%.
At the other end of the rankings, more than three-quarters of South Korea’s population used social media this time last year, thanks to the impressive uptake of local favorite, Kakao Talk.
There were almost 1.6 billion Facebook users around the world in January 2016, with the company’s two other top platforms – FB Messenger and WhatsApp – at 900 million and 800 million MAUs respectively.
Add in Instagram too, and Facebook Inc.‘s combined audience (ignoring the inevitable duplication across platforms) came to close to 4 billion users around the world.
Tencent – China’s social media darling, and the world’s second largest social media holding company in terms of combined MAUs – accounted for 2 billion active accounts across QQ, Qzone and WeChat, although these figures inevitably include a significant degree of duplication too.

Filipino users spent the most time on social media in 2016, averaging 3.7 hours each day on social platforms. Perhaps surprisingly, Japanese users claimed to use social media for less than 20 minutes each day, despite the increasing popularity of channels like LINE, Twitter and Facebook across the country’s 115 million internet users.

Mobile social was – again – the standout growth story for the year, but with only North America having passed the 50% penetration mark, there was still plenty more room for growth.

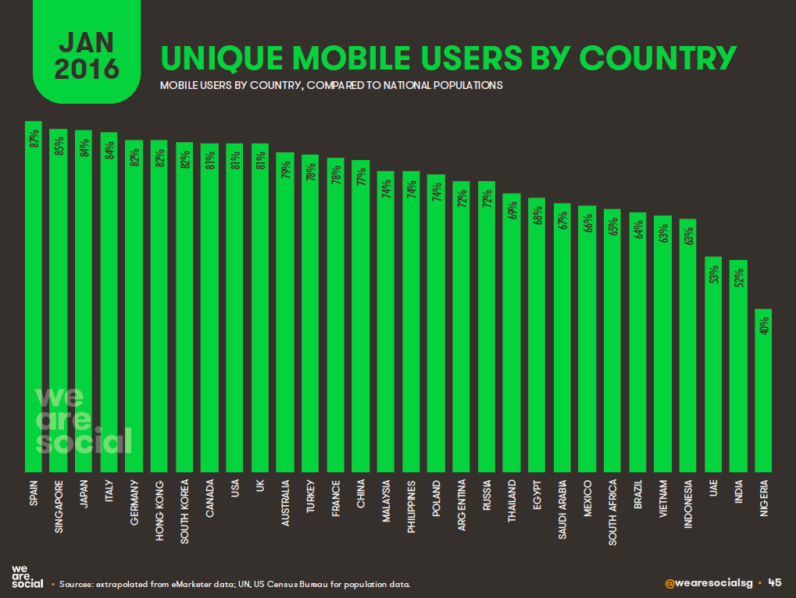
Nigeria was the only country in our top 30 economies where mobile phone penetration hadn’t reached 50% by January 2016, and over 20 of those markets already registered mobile penetration rates of more than two-thirds.
Feature phones still accounted for more than half of the mobile handsets in use, but the adoption of smartphones had grown considerably in the previous 12 months, and these devices accounted for 46% of active mobile connections by Q4 2016.

Digital in 2017
This year’s numbers show just how far our use of connected media and devices has grown in the 5 years since our first report.
As I reported in my analysis of this year’s numbers just a few weeks ago, the fact that more than half of the world’s population now uses the internet is testament to the contribution that the internet has made to people’s lives all over the planet.
More than 3.75 billion of us now use the internet, with that number still increasing at a rate of more than 11 new users every second.
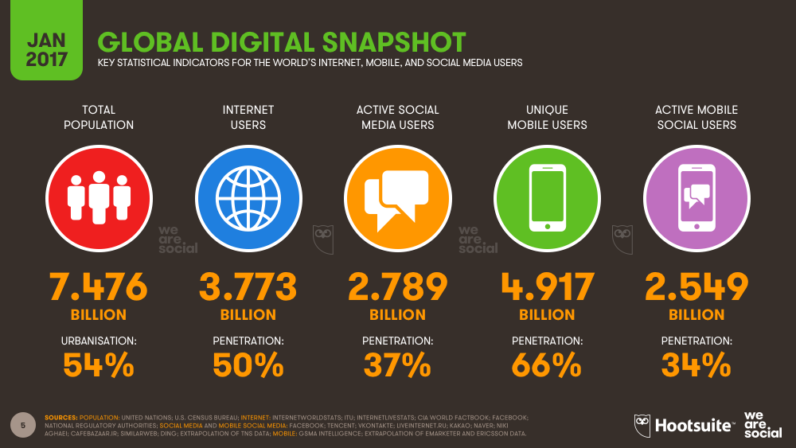
There were many more impressive milestones to report in January 2017 too:
- Smartphone penetration now accounts for 55% of all active mobile handsets, suggesting that more than half of the world’s population now uses a smartphone device.
- Almost two-thirds of the world’s population now has a mobile phone;
- More than half of the world’s web traffic now comes from mobile phones;
- More than half of all mobile connections around the world are now ‘broadband’;
- More than one in five of the world’s population now shops online.
What’s more, the speed of growth accelerated across most key digital indicators in 2016 too:

The double-digit growth figures are already impressive enough, but let’s put those percentages into perspective:
- Almost 1 million people will use the internet for the first time today;
- More than 15 people start using social media for the first time every second, meaning that about 75 people will start using social media in the time in takes you to read this sentence;
- 7 people start using a mobile phone every single second, and statistically, it’s likely that 6 of them do so using a smartphone;
- More than 1.5 million people start using mobile social media every day, which equates to more than 1,000 every minute, or more than 18 new users every second.
The latest data show no signs of this growth slowing either, so expect this pace of change to continue well into 2017.
You’ll find loads more great insights into this year’s report – produced in collaboration with We Are Social and Hootsuite – in my in-depth analysis of the key numbers and trends for 2017, which you can read in full by clicking here.
The Future
If you’d like to stay up to date with the latest data and trends in internet, social media and mobile use around the world, the simplest ways are to connect with me on LinkedIn and Twitter, but you might also want to bookmark http://kepios.com/data, where I’ll share the latest snapshots and updated reports as and when I publish them.
And if you have any questions or comments on all the numbers I’ve shared in this post, feel free to share them in the comments below.
https://thenextweb.com/insider/2017/03/06/the-incredible-growth-of-the-internet-over-the-past-five-years-explained-in-detail/ via https://thenextweb.com #CIO, #Technology


